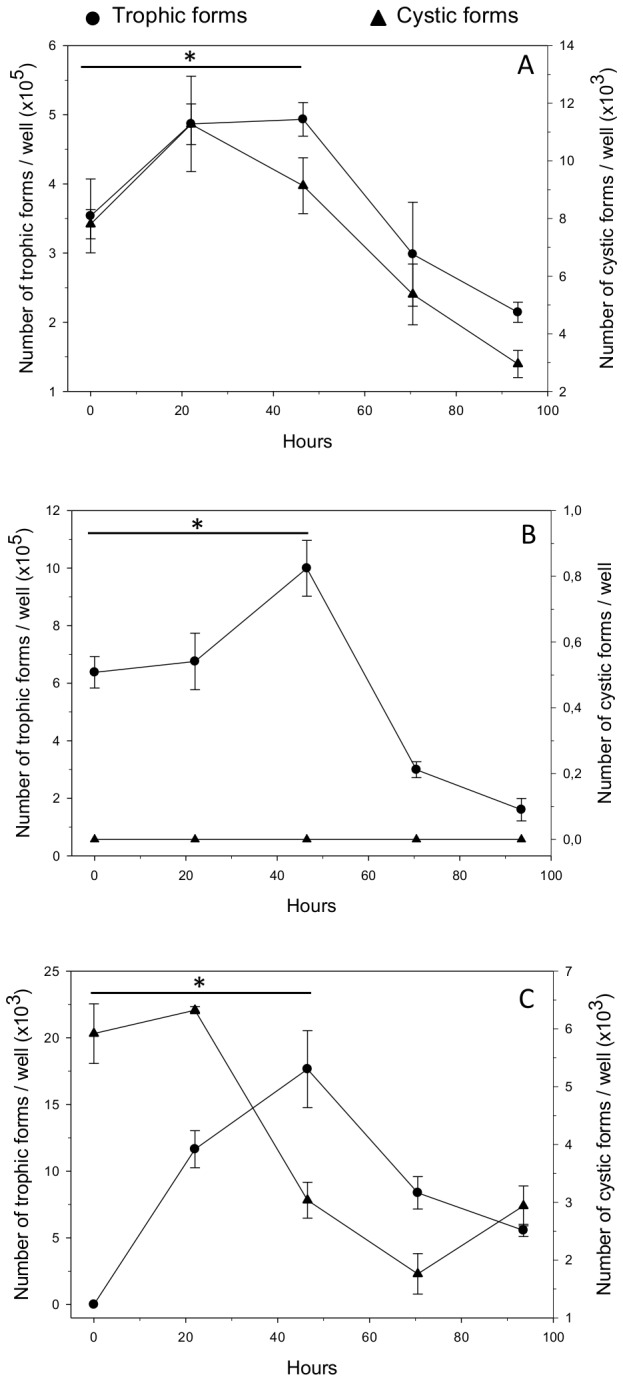
Figure 1. Growth of sorted P. carinii organisms in axenic culture.

Several P. carinii populations were cultured in DMEM with 10% FBS, at 37°C, in an atmosphere containing 5% CO2. Growth of (A) sorted P. carinii total population devoid of host cell debris, (B) pure P. carinii trophic forms, and (C) pure P. carinii cystic forms is followed during 4 days. Trophic forms (circles, left Y-axis) or cystic forms (triangles, right Y-axis) were microscopically quantified after RAL-555 panoptic staining [26-28]. For each population of P. carinii organisms studied, means of three replicates are represented per time point. Error bars represent standard deviations. The star (*) means P-value ≤ 0.05. The detection limit is 10 P. carinii organisms per culture well.
