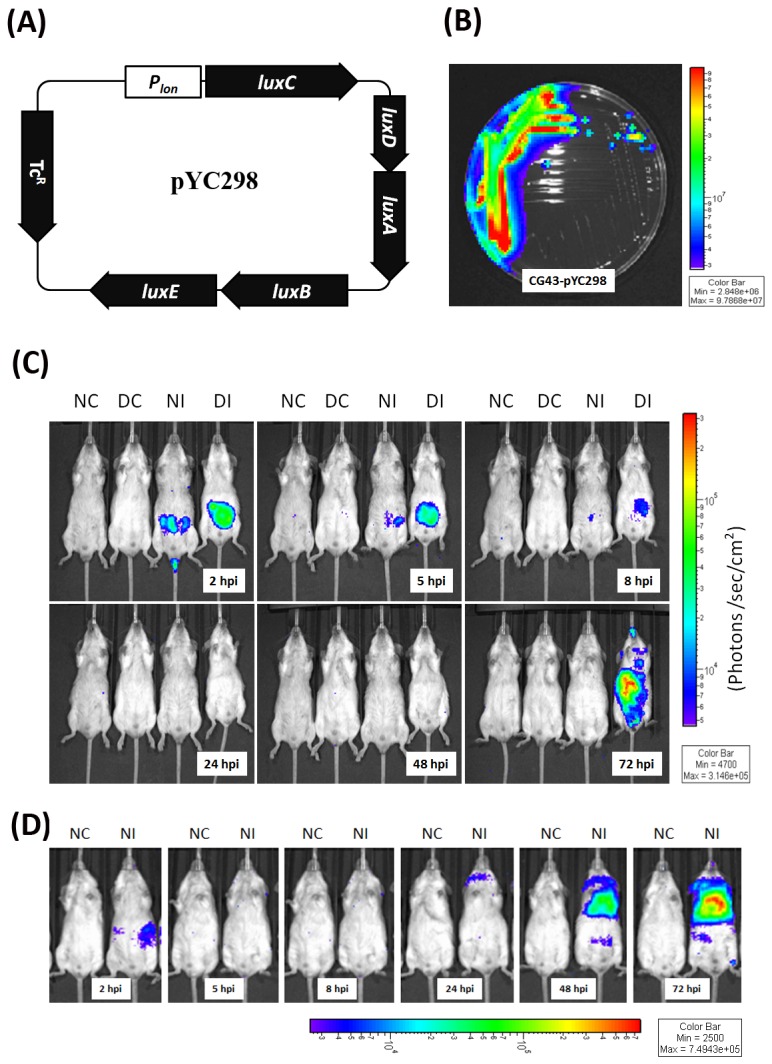
Figure 1. In vivo imaging of auto-bioluminescence-expressing K. pneumoniae.

(A) Map of pYC298. (B) Detection of bioluminescence light signals of K. pneumoniae CG43-pYC298 cultured on LB plate. (C-D) Groups of 15-wk-old male BALB/c mice were orally inoculated with PBS or 3 × 10⁸ CFU of log-phased K. pneumoniae CG43-pYC298. The mice were imaged at 2, 5, 8, 24, 48 and 72 hpi using the Xenogen IVIS system. The color overlay on the image represents the photons/second emitted from the mice in accord with the pseudo-color scale shown near to the images. Red represents the highest photons/second, while purple represents the lowest photons/second. The data are expressed as photons/seconds/cm2 in PBS-control naïve mice (NC), PBS-control diabetic mice (DC), K. pneumoniae-infected naive mice (NI) and K. pneumoniae-infected diabetic mice (DI), respectively from left to right.
