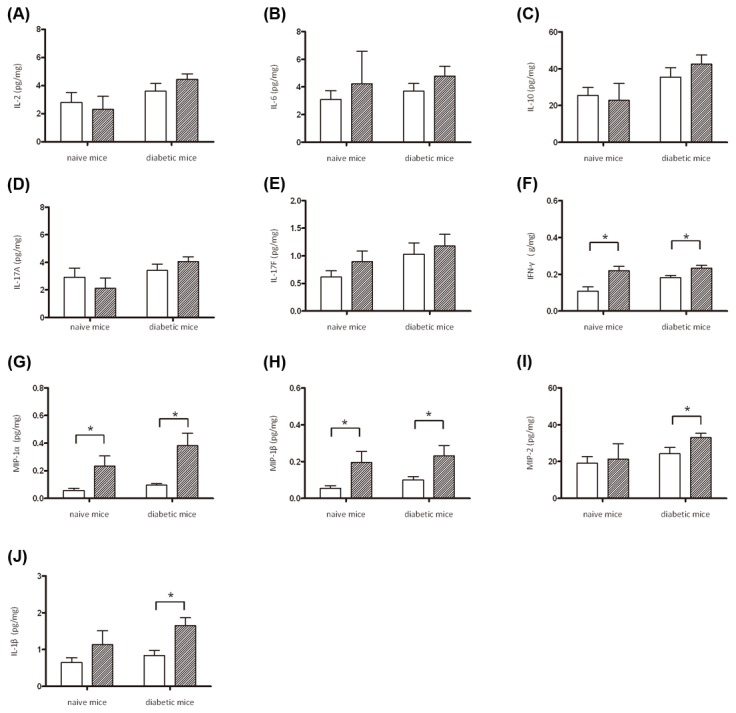
Figure 4. Production of cytokines and chemokines in hepatic responses to K. pneumoniae infection.

Liver lysates were prepared from PBS-control naïve mice (n=3), PBS-control diabetic mice (n=3), and the K. pneumoniae-inoculated naive and diabetic mice which had developed an extraintestinal infection at 72 hpi (the sample size in naïve and diabetic groups is 4 and 8, respectively). Protein levels of IL-2 (A), IL-6 (B), IL-10 (C), IL-17A (D), and IL-17F (E), IFN-γ (F), MIP-1α (G), MIP1β (H), MIP-2 (I), and IL-1β (J) were determined by ELISA and normalized with total protein amounts. Data are expressed as the mean ± SEM. An asterisk (*) represents a significant increase in the K. pneumoniae-infected naïve or diabetic group (slash bar) in comparison with the corresponding control group (empty bar) by the Mann-Whitney U test (one-tailed; P < 0.05).
