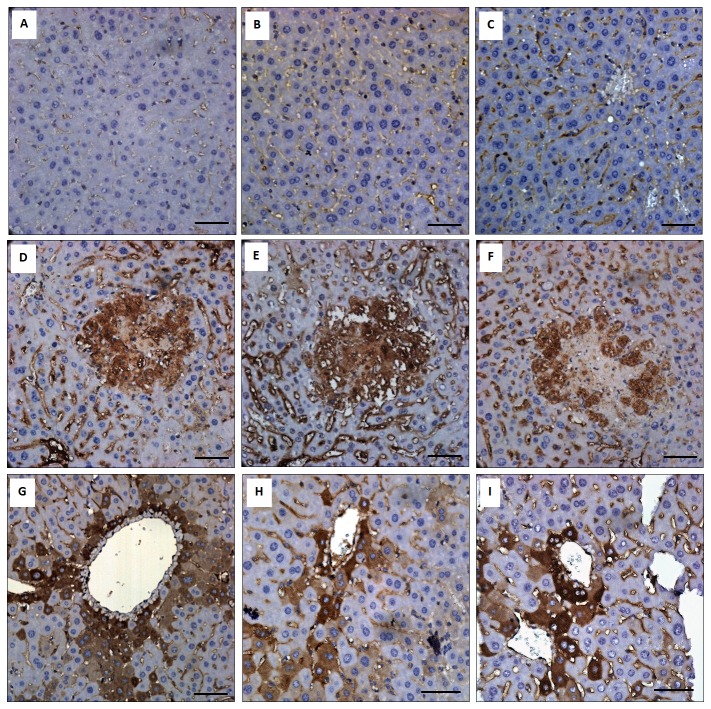
Figure 6. Immunohistochemistry analysis.
Distribution of phospho-STAT1 (A, D, and G), phospho-STAT3 (B, E, and H), and IRF-1 (C, F, and I) are shown in the liver of the PBS-control (A, B, and C), K. pneumoniae-infected diabetic mice (D, E, and F), and K. pneumoniae-infected naïve mice (G, H, and I). Scale bar represents a distance of 50 μm.

