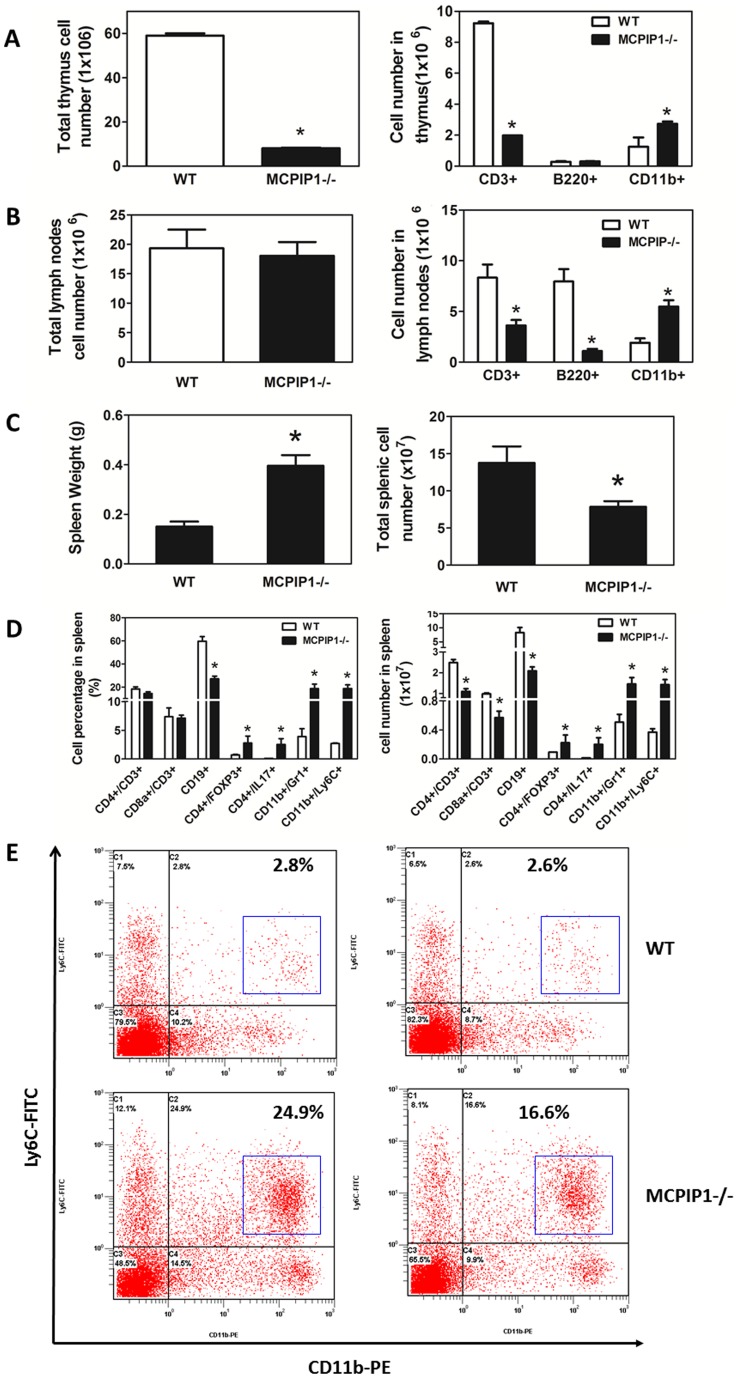
Figure 4. Bone marrow MCPIP1 deficiency altered leukocyte profile in immune organs.
A and B. Total number and flow cytometric analysis of immune cells in mouse thymus (A) and lymph nodes (B). *p<0.05 vs WT group. C. Spleen weight and total spleen cell numbers of LDLR−/− mice received WT or MCPIP1−/− bone marrow cells. D. Leukocyte profile of splenocytes by flow cytometry. *p<0.01, n = 6 (WT) or 9 (MCPIP1−/−). E. Representative flow cytometric graphs of spleen CD11b+/Ly6C+ cells. Majority of the CD11b+/Ly6C+ cells are CD11b+/Ly6Clow (Blue box).

