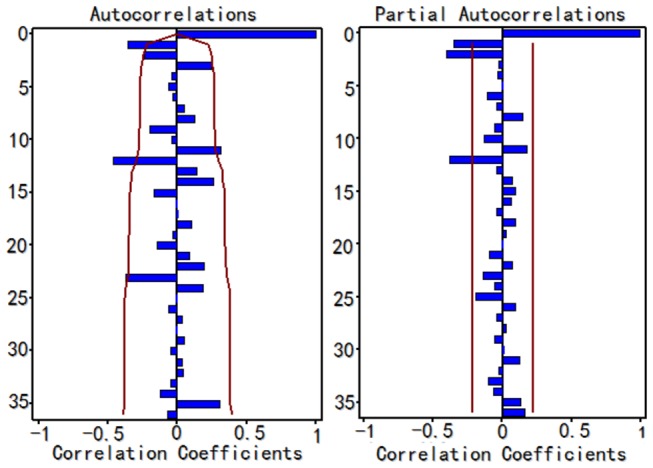
Figure 2. The ACF graph and PACF graph of the ARIMA (0,1,0) × (0,1,0)12 model.

ACF=autocorrelation function, PACF=partial autocorrelation fuction. After taking a non-seasonal and seasonal difference, the TB report rate series shows dominant peaks in the autocorrelation functions lags 12, 24 and 36 months indicating a strong seasonal pattern in the report rate of TB in Hubei Province, China.
