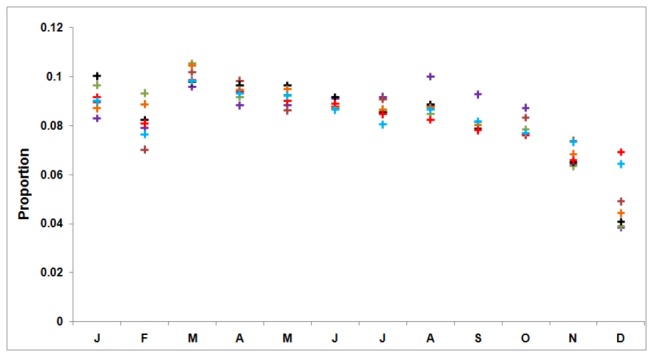
Figure 3. Proportion of tuberculosis cases by month of report.

Month begins with January and is abbreviated by first letter. It shows that TB cases exhibit a peak in March and a trough in December across the entire study period.

Month begins with January and is abbreviated by first letter. It shows that TB cases exhibit a peak in March and a trough in December across the entire study period.