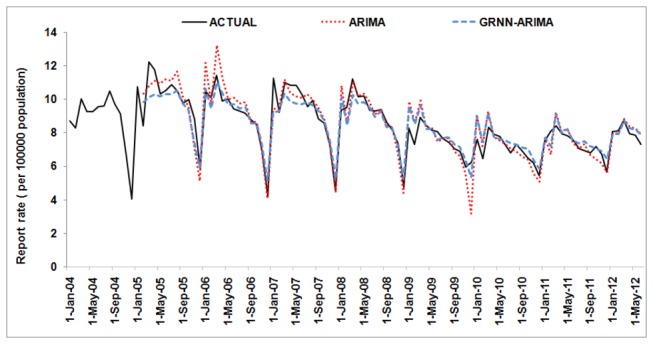
Figure 6. Two models’ fitting and prediction curves and the actual tuberculosis report rate series.

ARIMA=the autoregressive integrated moving average; GRNN=the generalized regression neural network.

ARIMA=the autoregressive integrated moving average; GRNN=the generalized regression neural network.