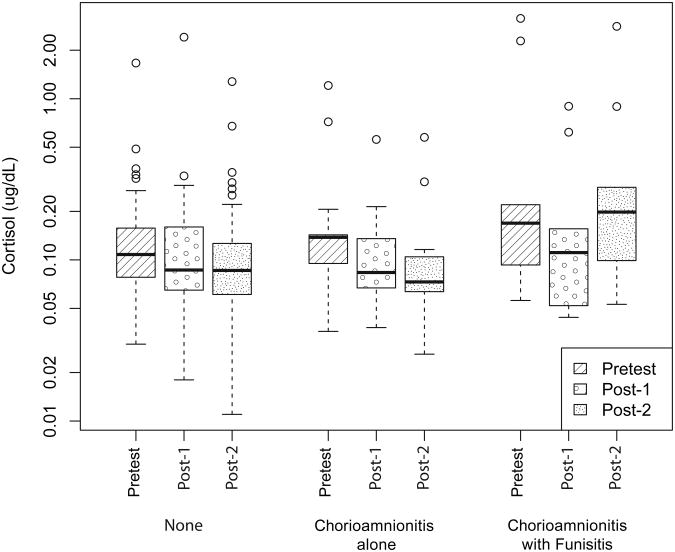
Figure 2. Cortisol Pattern by Prenatal Infection Group.
Cortisol across assessment phase (pretest, post-1 and post-2) by prenatal infection group: no infection (n=54), chorioamnionitis alone (n=13) and chorioamnionitis with funisitis (n=11). The lower and upper quartiles are represented by the top and bottom limits of each box, and the minimum and maximum data values by the “whiskers”. The median is represented by the bold line. Outliers (represented as points outside “whiskers”) were identified if they surpassed the upper or lower quartile by more than 1.5 times the inter-quartile range (IQR).

