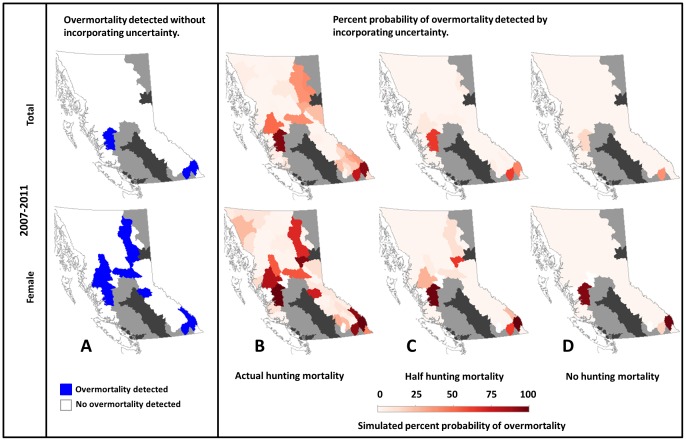
Figure 6. Total and female overmortalities of Grizzly Bear (U. arctos horribilis) Population Units (“population units”) of British Columbia, Canada, from 2007–2011 (see SI for additional periods).
A) Overmortalities detected given known hunting mortality levels and without consideration of mortality limit uncertainty. Blue indicates population units with detected overmortality whereas white indicates population units without. B–D) Simulated probability of total or female overmortality, incorporating uncertainty around mortality limits. Panel B shows simulated probability of overmortality given known mortality rates; panels C and D show what the probability of overmortality would be had hunting mortality been reduced by 50% or 100%, respectively, assuming other sources of mortality remained unchanged. Increasingly dark red indicates an increasing probability of overmortality in a given period. Grizzly bears have been extirpated from dark-grey areas. Light-grey areas indicate population units in which populations are either threatened or were closed to hunting during the study period.

