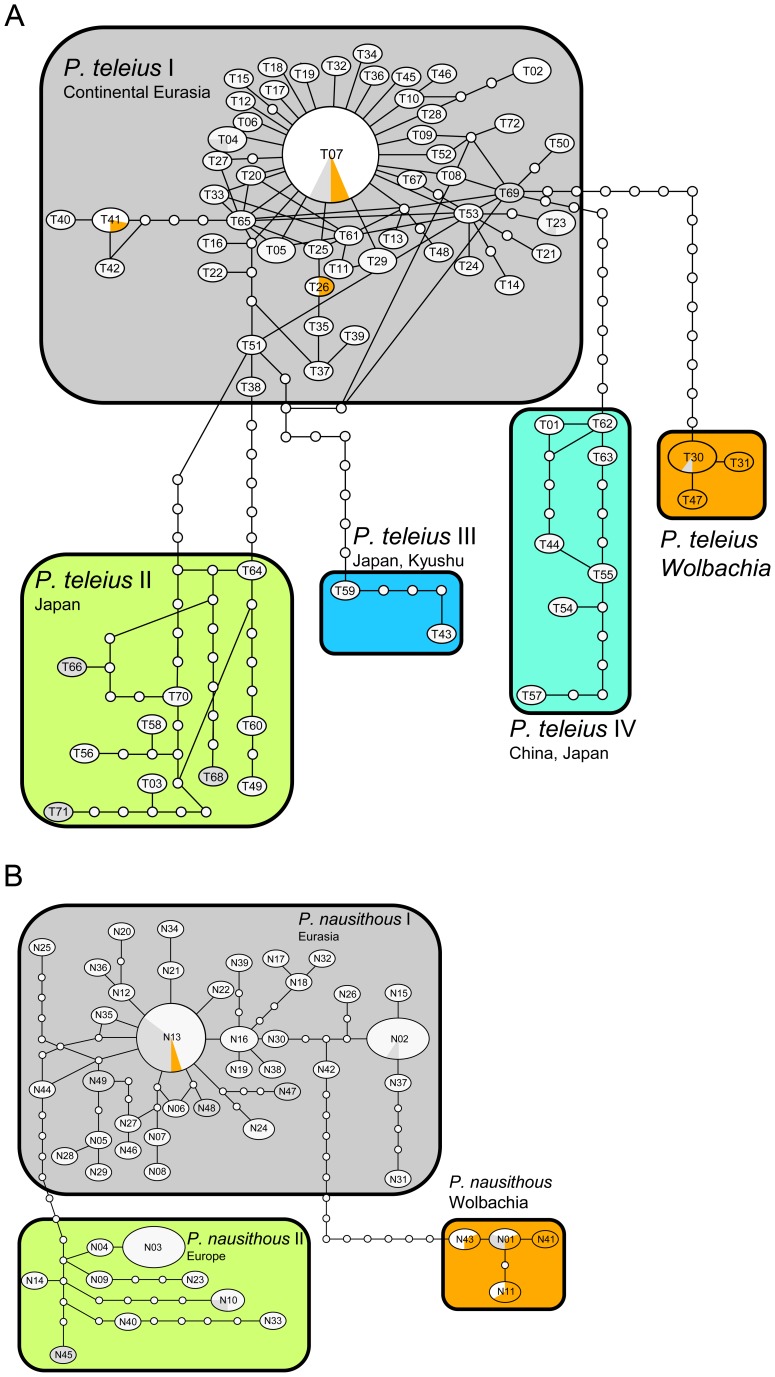
Figure 2. COI haplotype networks for Phengaris teleius (A) and P. nausithous (B).
Circle size is proportional to haplotypes frequency (Table S1). The proportion of individuals infected with Wolbachia is indicated by a colored pie chart. Note that in several haplotypes samples could not be tested for Wolbachia since the corresponding sequence was extracted from Genbank (grey shading).

