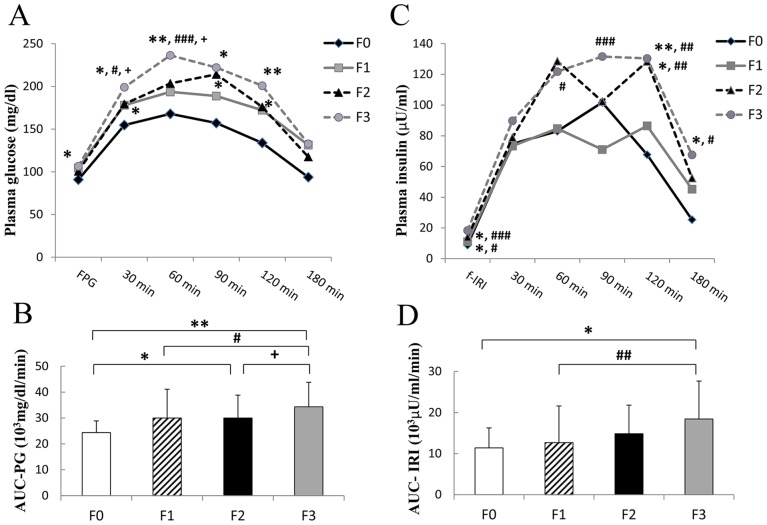
Figure 3. Patterns of glucose and insulin secretion in the 75gOGTT in relation to the progression of hepatic fibrosis.
A) The glucose levels were significantly elevated in accordance with the progression of fibrosis (Versus F0: *P<0.05, **P<0.01; Versus F1: # P<0.05, ### P<0.001; Versus F2: + P<0.05). B) Area under the curve (AUC) of plasma glucose levels (AUC-PG) was remarkably larger in accordance with the progression of hepatic fibrosis (F0 versus F2, *P<0.05; F0 versus F3, **P<0.01; F1 versus F3, # P<0.05; F2 versus F3, + P<0.05) C) Insulin secretion levels were remarkably higher in the patients with progression of hepatic fibrosis (Versus F0: *P<0.05, **P<0.01; Versus F1: # P<0.05, ## P<0.01, ### P<0.001). D) AUC of insulin secretion (AUC-IRI) was also significantly larger in accordance with the progression of hepatic fibrosis (F0 versus F3, *P<0.05; F1 versus F3, ## P<0.01). (Black diamond: F0: n = 10. Gray square: F1: n = 74. Black triangle: F2: n = 48. Gray circle: F3: n = 37; total, N = 169).

