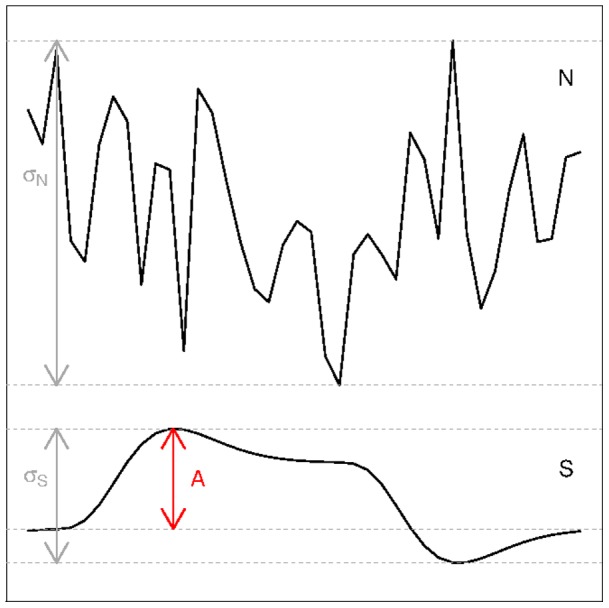
Figure 2. Illustration of the notation in the SNR and CNR definitions:  is the activation signal,
  the noise signal,
  defines the amplitude of the activation signal, and
  and
and  indicate the standard deviation of the activation signal and noise signal respectively.