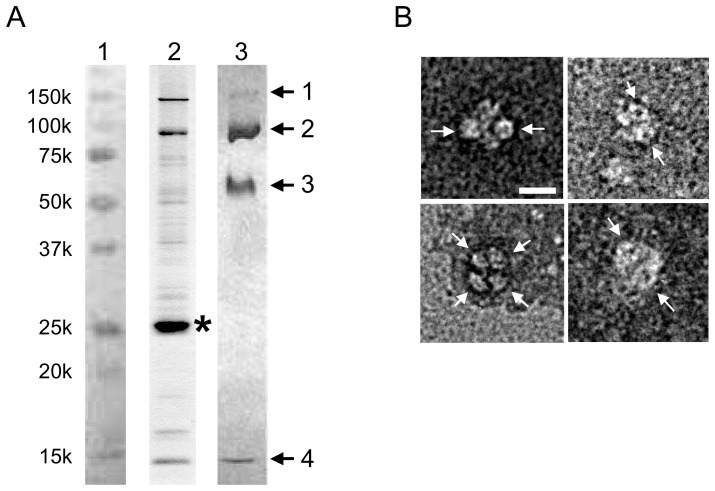
Figure 1. Characterization of protein samples.
(A) An SDS-PAGE pattern of isolated protein solution and crystals of the Hfq and catalase HPII complex dissolved in SDS buffer solution. Lanes are: 1, markers; 2, protein solution after nickel-affinity chromatography; and 3, crystals of Hfq and HPII complex. Arrows and numbers in lane 3 indicate samples for PMF MALDI-TOF analysis. Asterisk in lane 2 indicates an overproduced PomA protein with a histidine tag. Bands 1 and 2 were identified as dimer and monomer of HPII and bands 3 and 4 as hexamer and monomer of Hfq by the PMF analysis, respectively. Note that the fraction eluting from the nickel-affinity column contained significant amounts of both Hfq and HPII. (B) Typical electron micrographs of complexes of endogenous Hfq and HPII prepared with negative staining. Some ring-like structures with dimensions of 70 – 80 Å are indicated with arrows. Bar indicates 100 Å.

