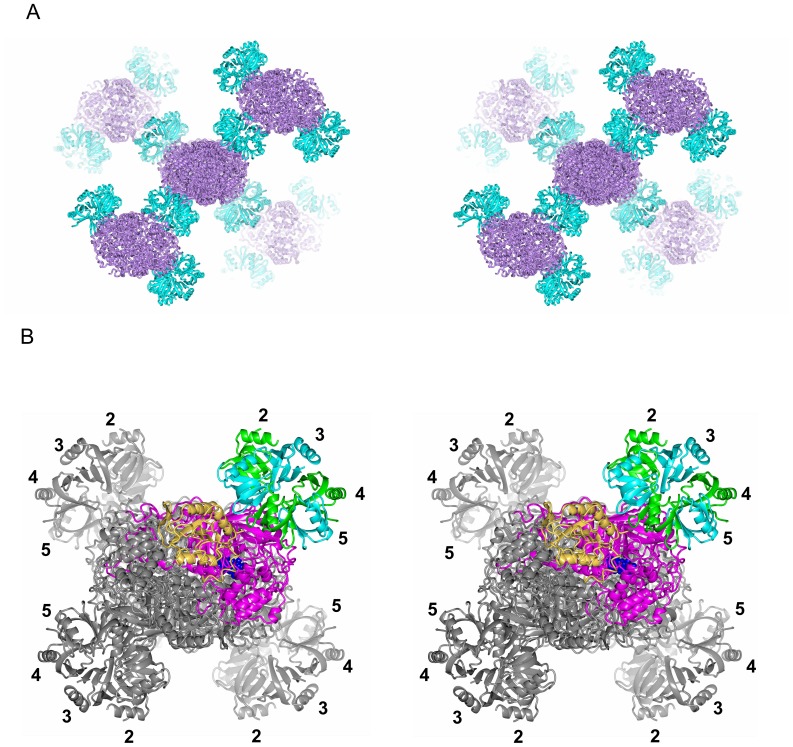
Figure 3. Crystal structure of the Hfq and catalase HPII complex.
(A) Stereo diagram showing the crystal packing of the complex composed of Hfq hexamers in cyan and HPII tetramers in violet. All the four bound Hfq hexamers are displayed for the HPII tetramer at the center, whereas only two hexamers are displayed for each surrounding HPII tetramer for clarity. (B) Structure of one HPII tetramer with four bound Hfq hexamers showing interaction through their distal surfaces. Viewed in stereo. Subunits of one Hfq hexamer are displayed in cyan and green. Numbers 2 – 5 indicate the subunit number in the Hfq hexamer as in Fig. 4. One molecule of the HPII tetramer is displayed in tan (the C-terminal lobe) and in magenta (the other parts). A space-filling model in blue represents heme. Other models are in grey.

