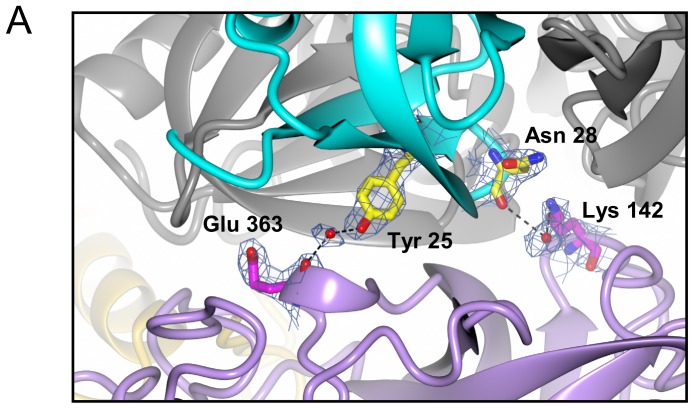
Figure 5. Interactions between Hfq subunit 5 and HPII.
Subunit 5 is displayed in cyan and one molecule of the HPII tetramer is color-coded as in Fig. 4A. Other models are displayed in grey. Interacting residues are drawn in ball-and-stick representation overlaid with 2 Fo - Fc maps of 1.0 σ, and atoms are color-coded as: nitrogen, blue; oxygen, red; and carbon, yellow in Hfq and magenta in HPII. Bonds are depicted as black dashes. Interactions of subunits 2 and 6 with HPII are shown in Fig. S4 in File S1 and those of subunits 1 and 4 are in Fig. S5 in File S1. See also Table S2 in File S1 for bond length and type.

