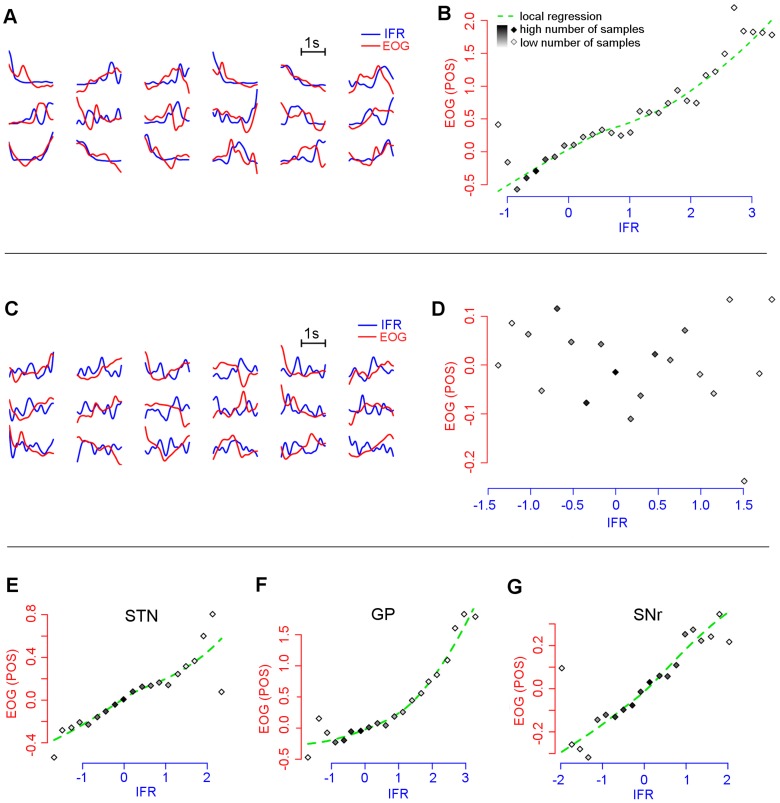
Figure 4. Neuronal activity during the scanning movement task.
Example of neuron related (A, B) and unrelated (C, D) to eye movements based on correlation analysis of the instantaneous firing rate (IFR) and eye position (POS) derived from the electrooculography (EOG). All eye movement-related neuronal populations in the STN, GP and SNr are plotted in figures E, F, and G. Figures A, C show the IFR (blue) and EOG (red) pairs recorded during epochs of the task involving both the black screen and pictures presentations. Figures B, D, E, F, G show the dependency of the normalized eye position (POS) derived from the electrooculography (EOG) on the normalized, sorted and binned amplitude of the instantaneous firing rate (IFR). While the IFR from a single neuron was used on figures B and D; the IFR from all eye sensitive neurons were used on figures E, F, and G for each nucleus separately. The amplitudes of the POS signals which correlated negatively with the IFR signal were reversed. The number of signal samples in each bin is expressed by different shades of grey in the diamond glyphs.

