
Figure 2. Relationship between milk fat and cell contents in all the participants for all the feeds and repeats (N = 36).
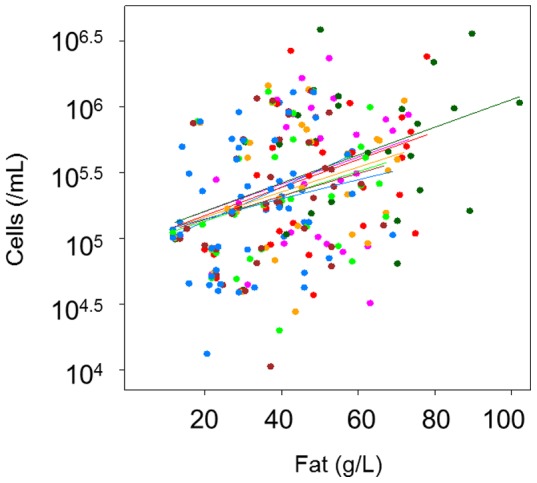
Lines indicate different sampling points, showing a consistent pattern over time. Different colors indicate different sampling time points. Cell content was strongly and linearly related to fat content (P<0.001), after accounting for the effect of time.