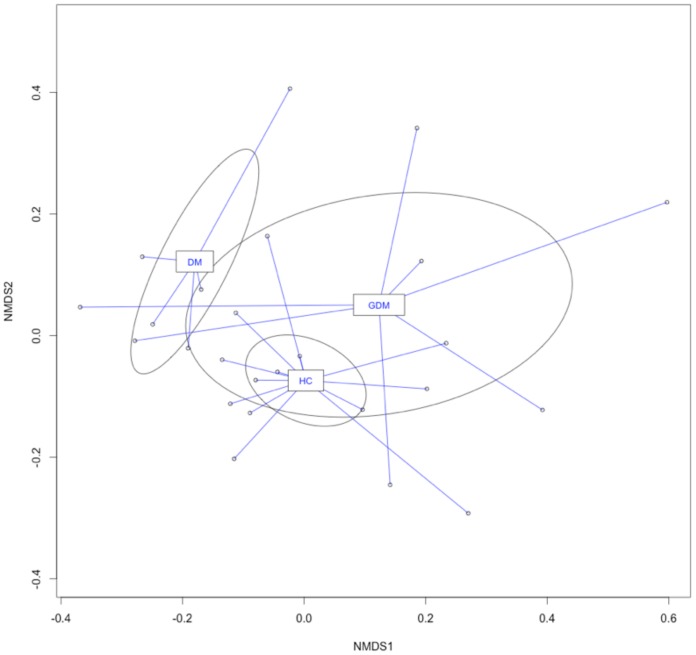
Figure 3. Comparison of meconium microbiota from neonates born to HC (healthy), DM (type 2 diabetes) and GDM (gestational diabetes) mothers using nMDS ordination.
The unweighted UniFrac distance matrices generated from QIIME were visualized in nMDS plot. Lines connect individual communities to the centroid values for each group. The ellipses were drawn to represent the class standard errors.

