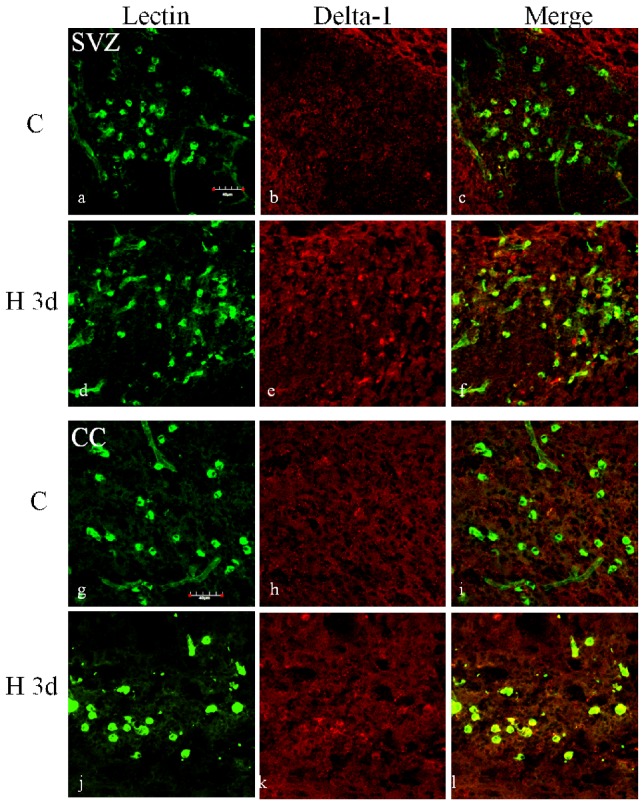
Figure 9. Delta-1 expression was increased in the microglial cells in subventricular zone and corpus callosum of neonatal rats following hypoxic exposure.
Confocal images showing the distribution of lectin (green) and Delta-1 (red) immunoreactive microglial cells in the subventricular zone (a–f) and corpus callosum (g–l) of neonatal rats at 3 days after hypoxic exposure and the corresponding control. Very weak Delta-1 expression (arrows) is detected in the SVZ of control rats, but the immunoflurorescence intensity is enhanced and more Delta-1 positive microglial cells are observed after hypoxia. In the corpus callosum, Delta-1 expression is barely detected in microglia of control rats (h and i) and some Delta-1 positive cells colocalized with lectin (arrowheads) are seen after hypoxia (k and l). Scale bar = 40 µm.

