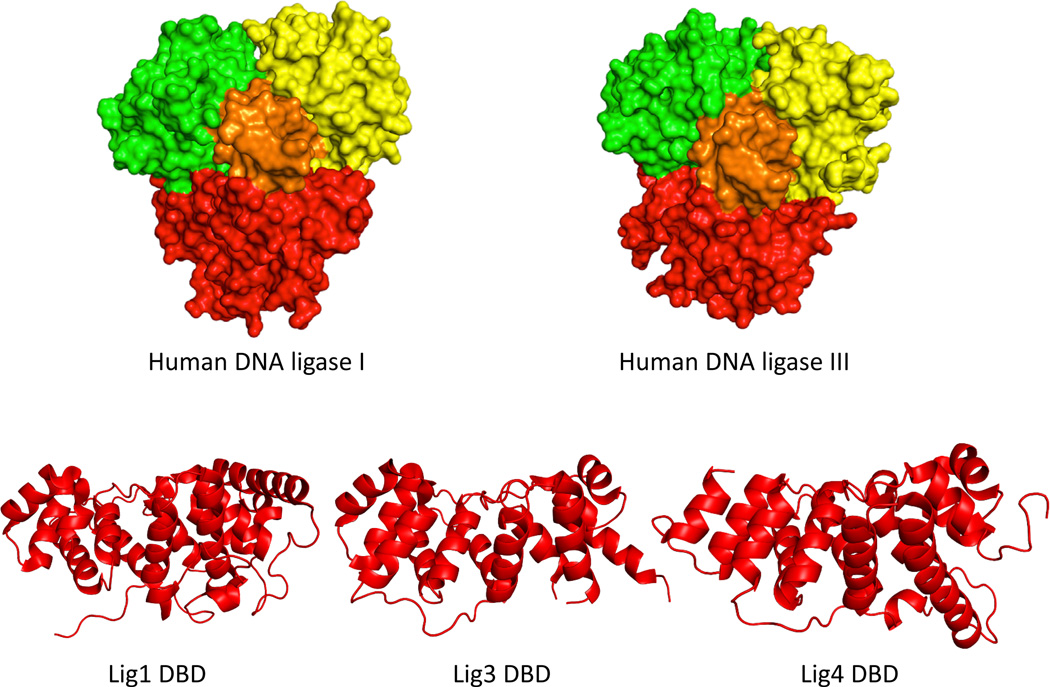
Figure 2.
Structures of human DNA ligases. A. Comparison of space-filling representations of the catalytic regions of buman DNA ligase I (Left panel) and human DNA ligase III (Right panel) bound to nicked DNA. The DNA binding domain is indicated in red, the adenylation domain in green, the oligonucleotide/oligosaccharide binding-fold domain in yellow and the nicked DNA in orange; B. Ribbon diagrams showing the secondary structures of the DNA binding domains of human DNA ligases I, III and IV

