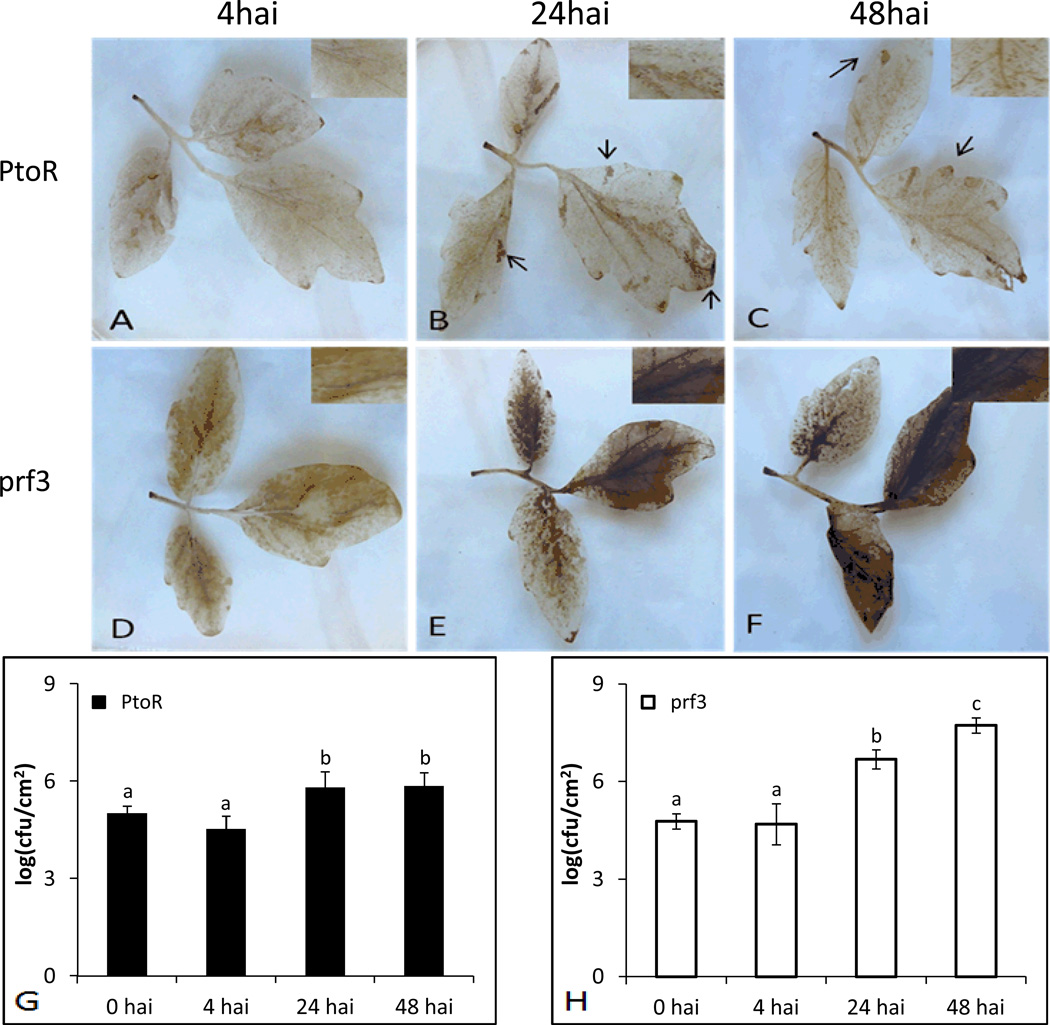
Figure 1.
DAB staining of leaves and bacterial growth assay between genotypes and time points after Pst inoculation. Zoomed in areas show specific H2O2 staining in cells or a flooding of H2O2 in the apoplast. Arrows indicate areas of HR. Letters a, b and c indicate a significant change (p-value <0.05) as determined by ANOVA. (A) PtoR 4hai; (B) PtoR 24hai; (C) PtoR 48hai; (D) prf3 4hai; (E) prf3 24hai; (F) prf3 48hai; (G) bacterial growth compared amongst time points in PtoR; (H) bacterial growth compared amongst time points in prf3.

