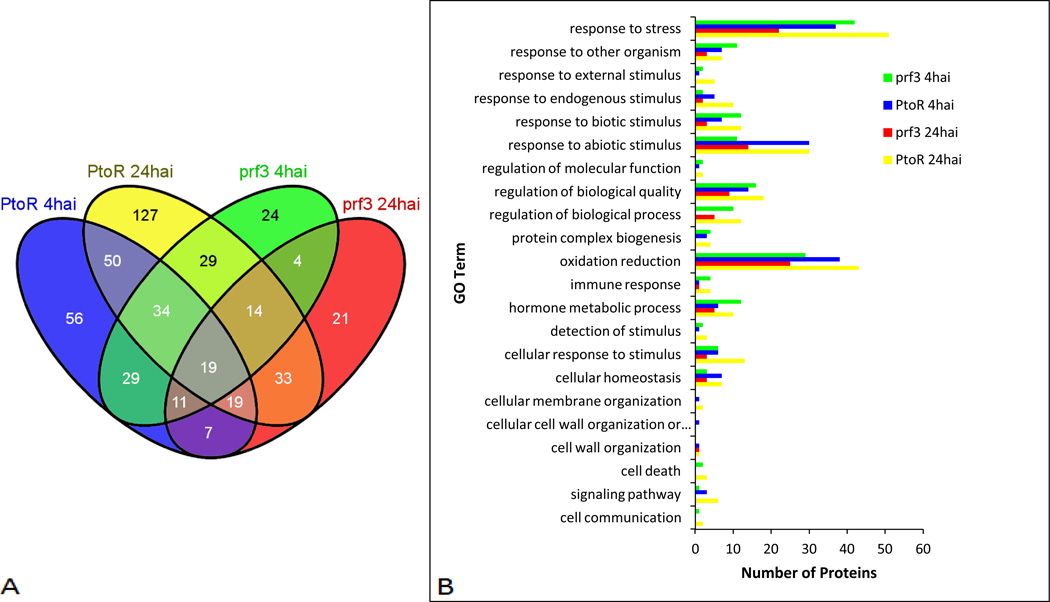
Figure 2.
Proteomic changes between time points and genotypes. (A) Venn diagram showing unique and shared proteins between time points and genotypes. (B) Biological process analysis for unique proteins with a significant change in expression for both time points and genotypes. Processes are representative of Blast2Go level 3 sorting. Proteins may be identified in more than one process.

