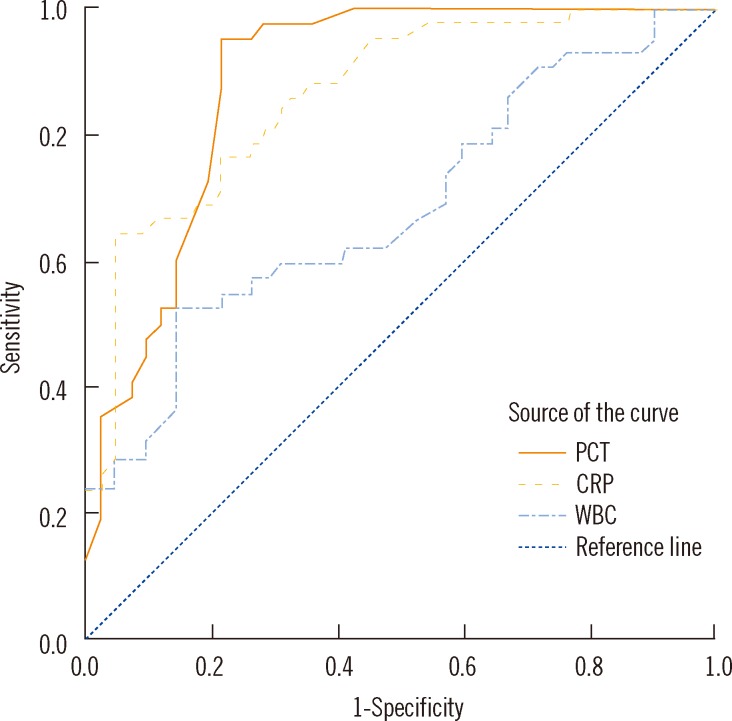
Fig. 2.
ROC curve showing the diagnostic values of PCT, CRP, and WBC for the differentiation between CSHB patients with and without SBP. Areas under the curve were calculated for PCT (AUC, 0.89; 95% CI, 0.81-0.96; sensitivity 95% and specificity 79% at the optimal cutoff of 0.48 mg/L), CRP (AUC, 0.86; 95% CI, 0.78-0.94; 64%/95% at 16.15 mg/L), and WBC (AUC, 0.68; 95% CI, 0.57-0.78; 52%/86% at 8.23×10⁹ cells/L).
Abbreviations: AUC, area under the curve; CRP, C-reactive protein; CSHB, chronic severe hepatitis B; PCT, procalcitonin; SBP, spontaneous bacterial peritonitis; WBC, white blood cell.

