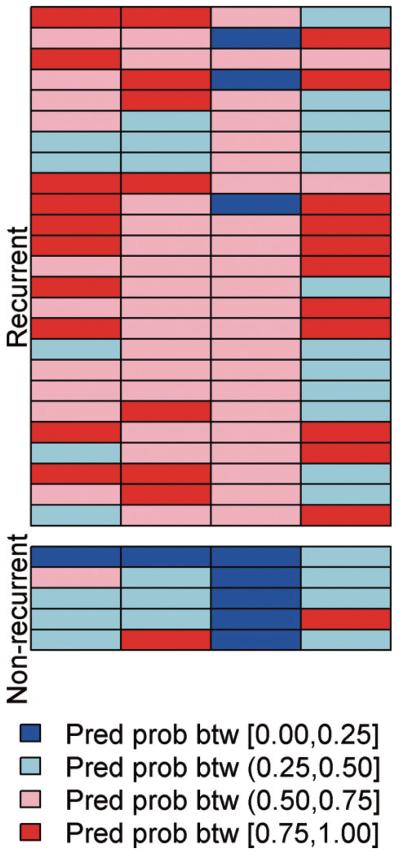
Fig. 2.
Representation of predicted probability of recurrence of ovarian cancer patients based on the performance of each biomarker derived from bootstrapped samples. Representation of predicted probability of recurrence of OVCA patients based on the performance of each biomarker derived from bootstrapped samples. The predicted probabilities for Mec1 4B7 and Mec1 5H6 were computed as the median predicted value from the “testing set” from 10,000 bootstrapped logistic regression analyses (which always included the 10 samples previously used in the training set). The predicted probabilities for Mec1 4H4 and p53 were computed as the median predicted value from the “testing set” from 10,000 bootstrapped CART analyses (which always included the 10 samples previously used in the training set). The predicted recurrence probabilities are classified and color-coded into 4 groups with break points at 0.25, 0.50 and 0.75. The samples with light or dark blue are predicted to be non-recurrent based on the models while those with light or dark red are predicted to be recurrent based on the models. The testing samples are all displayed, stratified by their true recurrence status. (Colours are visible in the online version of the article; http://dx.doi.org/10.3233/CBM-2012-0265)

