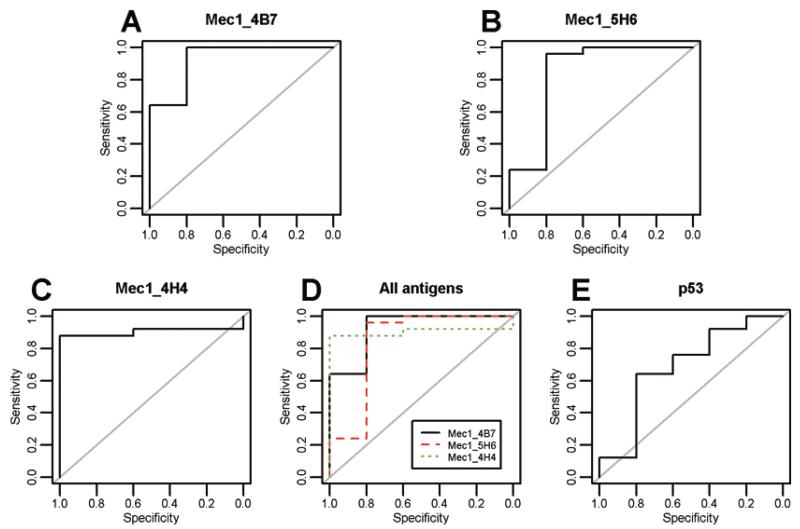
Fig. 3.
Comparison of receiver operating characteristic (ROC) curves of the 3 antigens to p53. ROC curves of the 3 antigens Mec1 4B7 (A), Mec1 4H4 (B), Mec1 5H6 (C) individually and in combination (D) and p53 (E). (Colours are visible in the online version of the article; http://dx.doi.org/10.3233/CBM-2012-0265)

