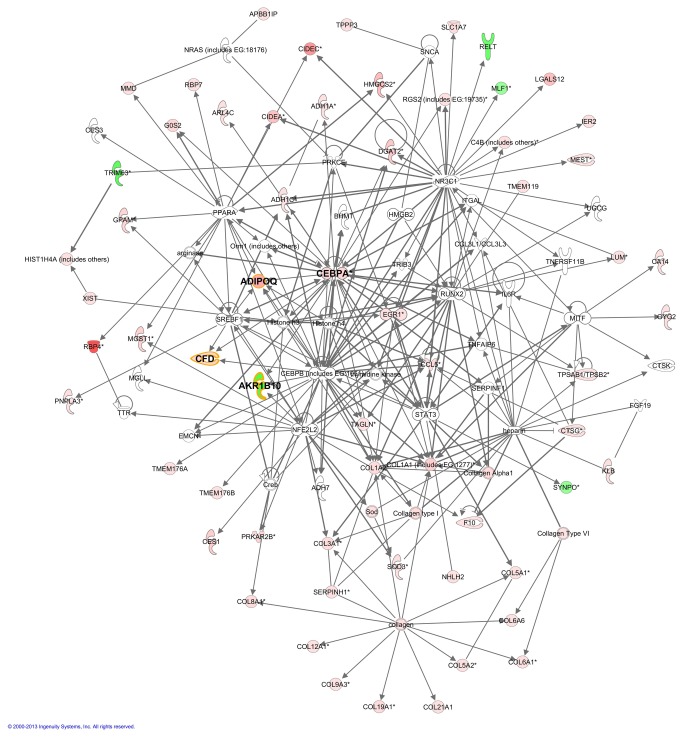
Figure 2. Merging of three well scored IPA networks of regulated genes in UCMD patients.
Gene networks involved in Connective Tissue Disorders, Dermatological Diseases and Conditions, Gastrointestinal Disease (network 2, Table S4); Lipid Metabolism, Molecular Transport, Small Molecule Biochemistry (network 6); and Inflammatory Response, Cellular Movement, Haematological System Development and Function (network 8). The intensity of the node color indicates de degree of up-(red) or down- (green) regulation in UCMD compared to control. Genes in uncoloured notes were not identified as differentially expressed in our experiment and were integrated into the computationally generated networks on the basis of the evidence stored in the IPA knowledge database indicating a relevance to this network. Nodes are displayed using various shapes that represent the functional class of the gene product.

