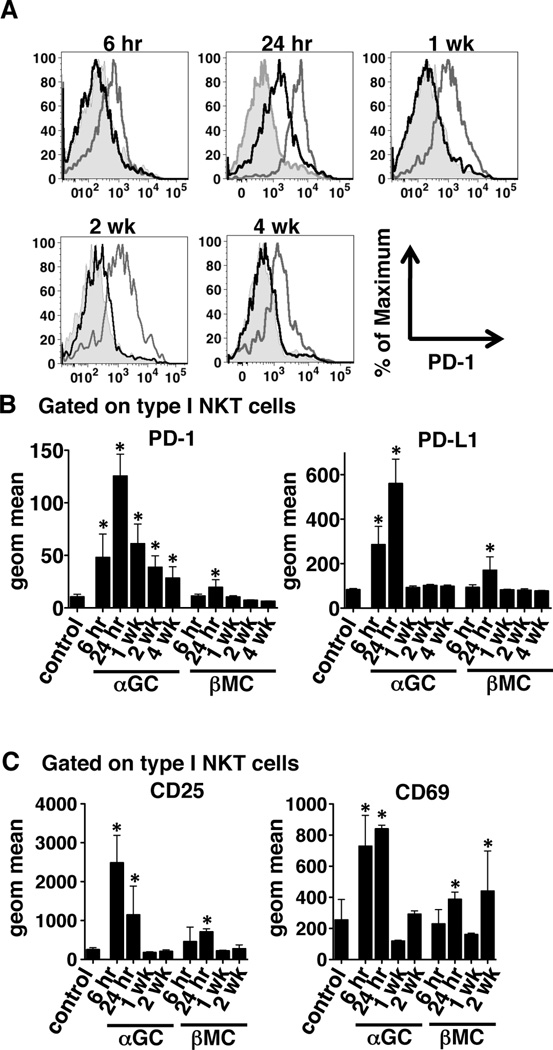
Figure 3.
β-ManCer activates but does not induce sustained expression of PD-1 on iNKT cells in vivo. Mice were injected with 2.4 nmol (2 µg) α-GalCer or β-ManCer or vehicle control. At the indicated time points, splenocytes were harvested and stained for analysis by flow cytometry. Samples were gated on CD3intermediateα-GalCer/CD1d tetramer+ cells and assayed for PD-1, PD-L1, CD25, and CD69 expression. (A) Representative histograms of PD-1 expression on gated iNKT cells are shown for each time point. Shaded area = control, gray line = α-GalCer, black line = β-ManCer. (B and C) Geometric mean fluorescent intensity was determined by data analysis in FlowJo for (B) PD-1 and PD-L1 and (C) CD25 and CD69 on gated iNKT cells. Representatives of at least 2 experiments are shown. Bars represent mean±SD of at least 4 mice per group. *, statistically significant vs vehicle control, p<0.05

