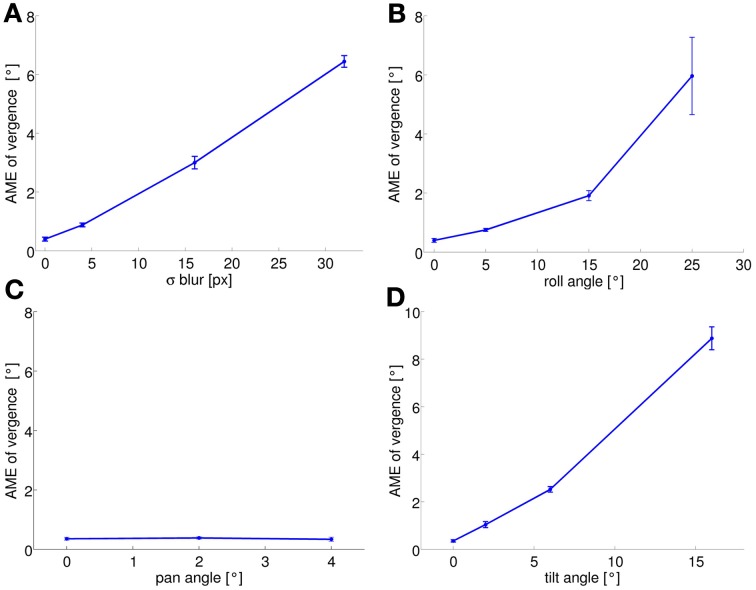
Figure 4.
AME of vergence at the end of training is plotted as a function of the level of each perturbation (average over 5 simulation runs): (A) blur; (B) roll; (C) pan; (D) tilt. AME increases with the level of a perturbation for all types of perturbation, except the pan perturbation (see text). Error bars represent one standard deviation.

