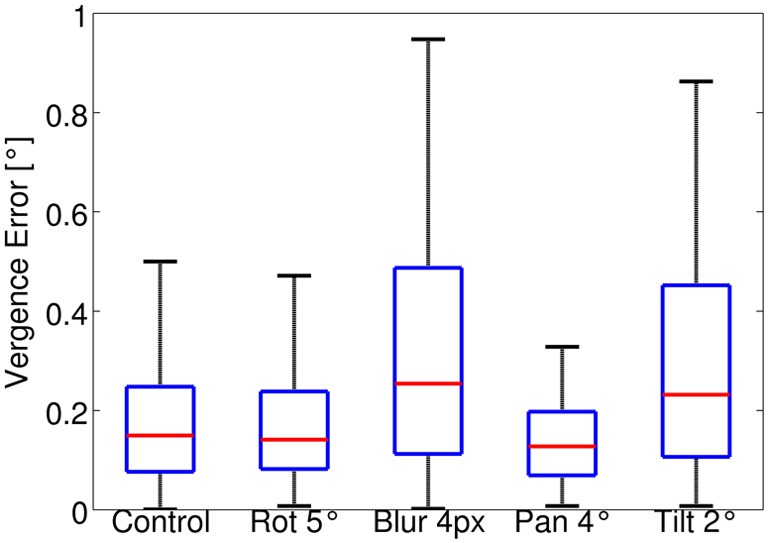
Figure 5.

Box plot of the vergence error in the test session for all types of perturbations considered. The red line in each box indicates the median; edges of a box are the 25th (q1) and 75th (q3) percentiles. The whiskers extend to values up to q3+1.5(q3 – q1). The plotted range extends up to approximately ± 2.7 σ (standard deviation) of the data. Values outside this range are considered outliers and are not plotted.
