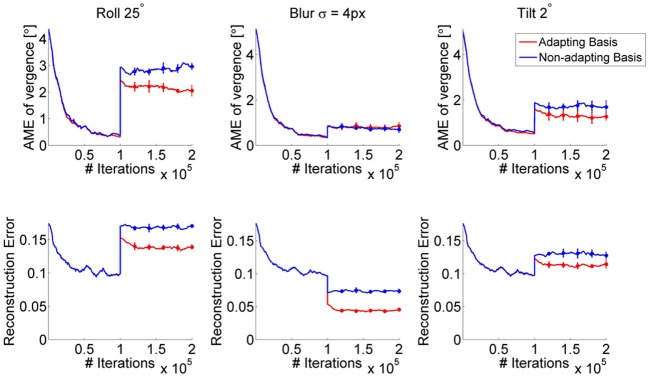
Figure 7.

AME (first row) and reconstruction error of the fine scale sparse coding models (bottom row) when the bases of the sparse coding models are adapted (red) vs. fixed (blue). The perturbation occurs after 100,000 iterations. Curves show the average over 5 simulations. Error bars represent one standard deviation.
