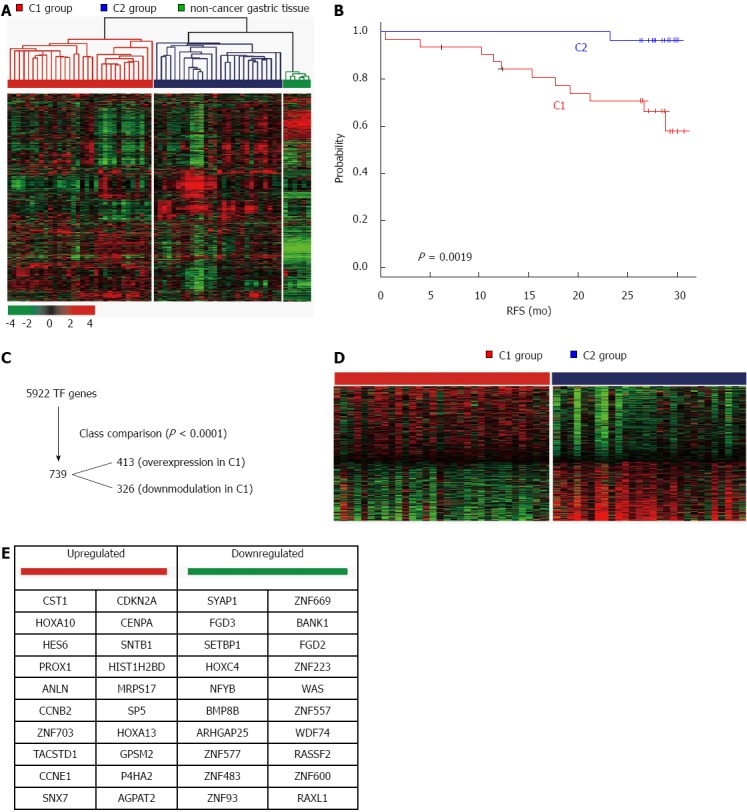
Figure 1.

Two prognostic groups of patients with gastric cancer, C1 and C2, have distinct mRNA expression patterns. A: mRNA expression patterns of gastric cancer and non-cancer gastric tissue are depicted in a heat map. Hierarchical clustering revealed two subtypes of gastric cancer, C1 and C2. The data are presented as a matrix in which rows represent individual mRNAs and columns represent each tissue. The color red represents relatively high expression levels and green reflects lower expression levels; B: Kaplan-Meier plot of relapse-free survival (RFS) revealed C1 and C2 represented poor- and good-prognosis gastric cancer tissues, respectively; C: Workflow of C1-specific 739 transcription factors (TFs) selected from a total 5,922 TFs; D: Hierarchical clustering of gene expression for 739 TF genes; E: List of top 20 up- and down-regulated TF genes in the C1 group.
