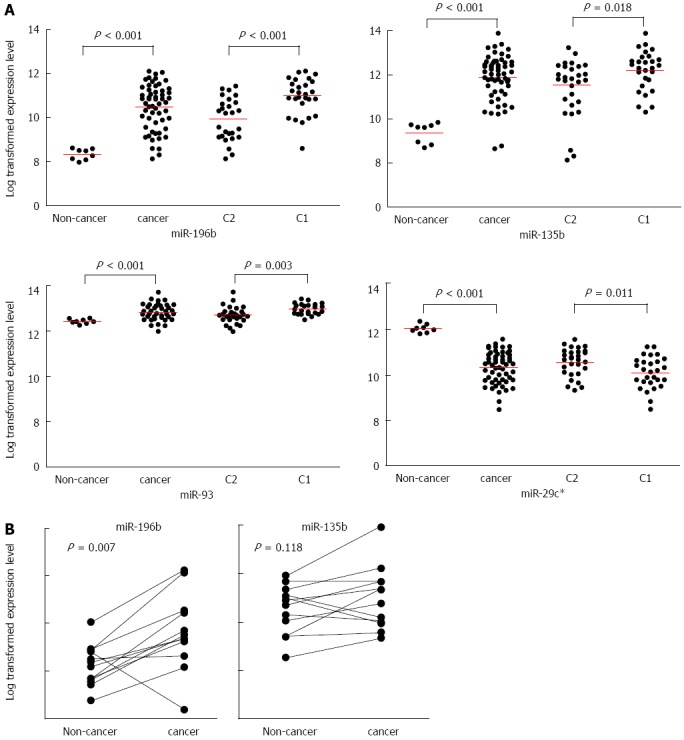
Figure 3.

The expression levels of four microRNAs. A: Four microRNAs expressed differentially in gastric tissues. Scatter plots of gene expression levels with a bar indicating the mean; B: The expression level of miR-196b and miR-135b were validated in a quantitative reverse transcription polymerase chain reaction study of 12 patients samples.
