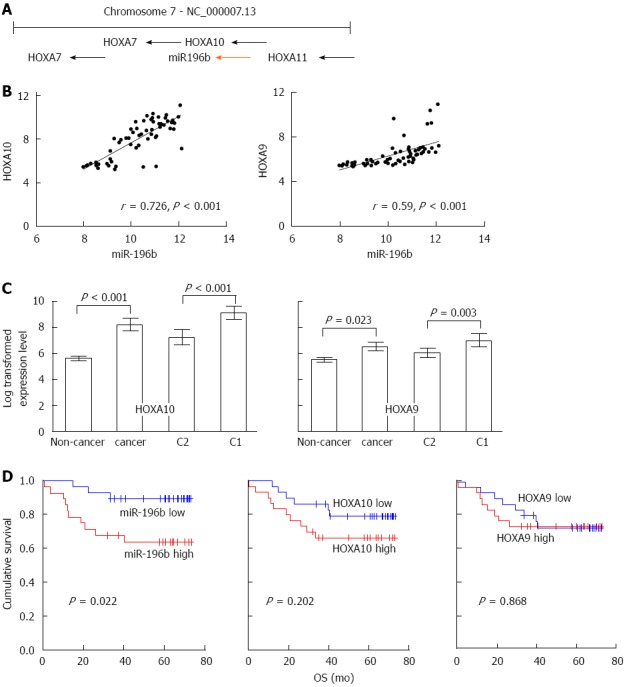
Figure 4.

The correlation between miR-196b and homeobox A10 expression in gastric cancer. A: miR-196b, homeobox A10 (HOXA10), and HOXA9 are neighbor genes and located on chromosome 7p15.2; B: Expression of miR-196b and HOXA10 were positively correlated (r = 0.726; P < 0.001). The correlation between miR-196b and HOXA9 expression was less significant; C: HOXA10 and HOPXA9 expression level in gastric cancer vs non-cancer tissues and in the C1 vs the C2 group. Results are presented as means with 95%CI; D: Kaplan–Meier plot of overall survival according to the expression level of miR-196b, HOXA10, and HOXA9.
