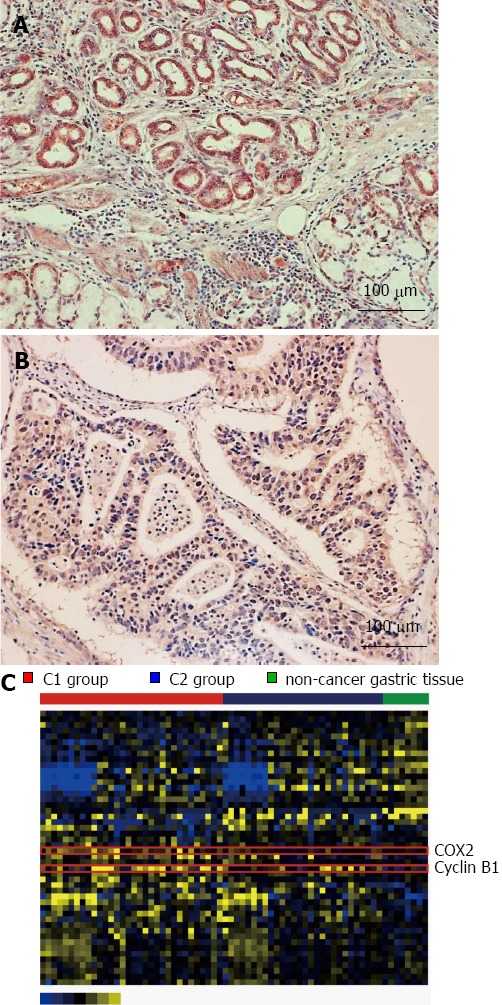
Figure 5.

Aberrant protein expression in gastric cancer. A: Representative image from the homeobox A10 (HOXA10) immunohistochemical assay (× 200) of gastric cancer tissue. The moderately differentiated adenocarcinoma shows positive for HOXA10 expression. A strong cytoplasmic immunoreaction was noted; B: Negative for HOXA10 expression; C: The expression pattern of 48 proteins from Reverse-phase protein array (RPPA) was depicted using a heat map. The color yellow represents relatively high expression levels and blue reflects relatively low levels.
