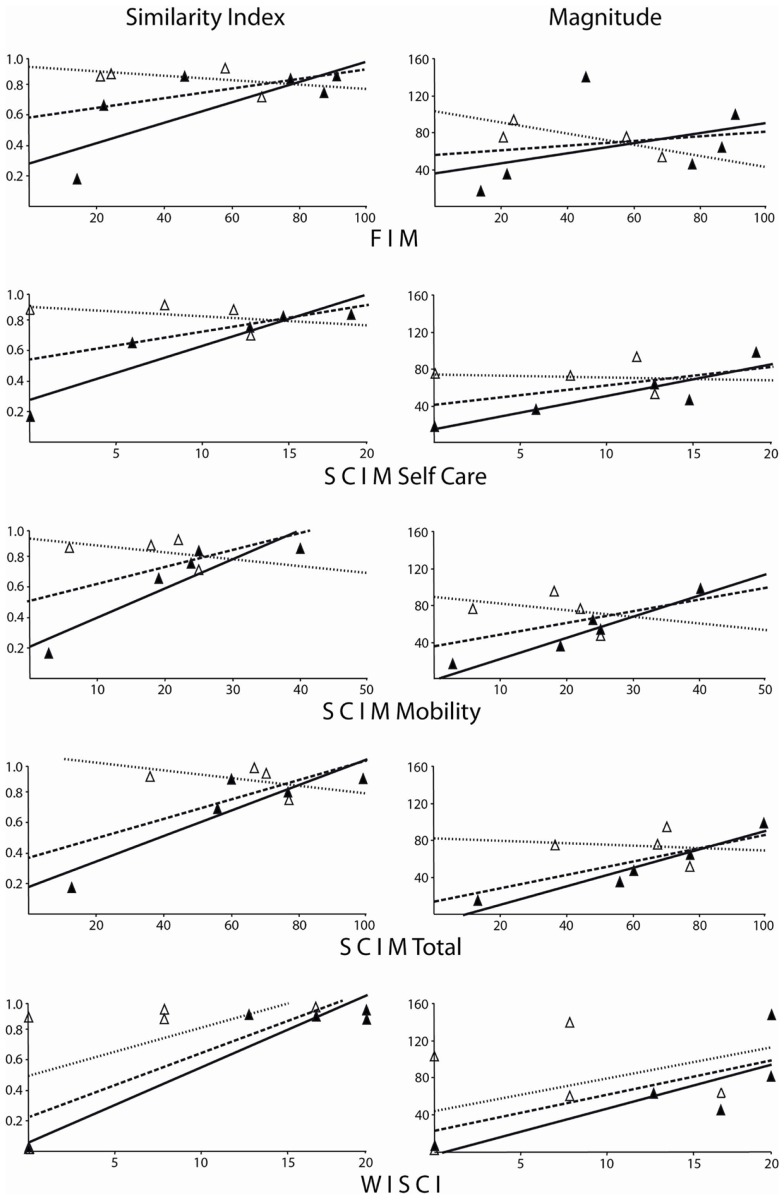
Figure 3.
Similarity and magnitude values corresponding to functional scale scores for FIM, SCIM, and WISCI examinations. Open triangles are for early assessment post-injury and filled triangles are for late examinations. Linear trend lines are shown for overall (dashed), early (dotted), and late groupings (solid). Spearman’s correlation coefficients can be found in Table 4. For the overall, early and late combined grouping, only WISCI scale scores significantly correlated with neurophysiological parameters. SI and Mag values from late examination groupings correlated well with function scale values, reaching significance for SCIM and WISCI scales.

