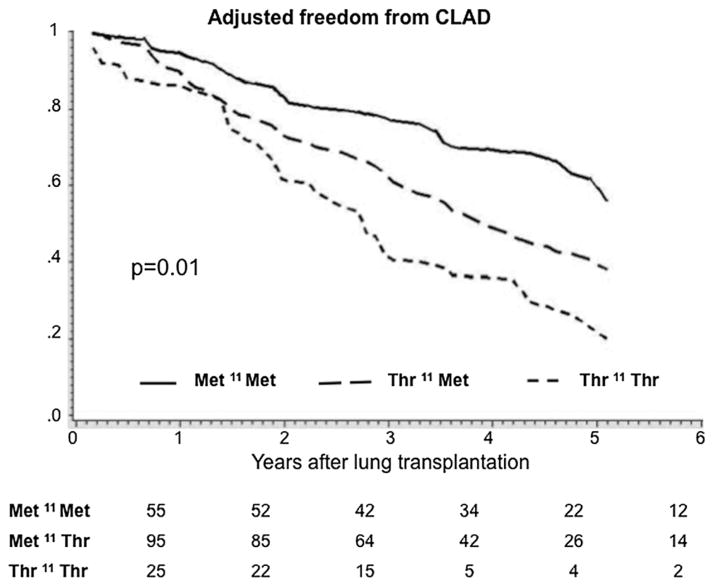
Figure 1. Multivariable adjusted freedom from CLAD curves for recipients grouped according to the lung allograft donor SP-D polymorphic variations for aa11 (Met11Thr).
Adjusted survival estimates are stratified for donor ethnicity and adjusted for recipient covariates (age at the time of transplant, diagnosis, laterality and CMV mismatch). From Table 7 adjusted p = 0.01 for trend. The numbers at the bottom indicate the numbers of lung transplant recipients free of CLAD at each year. The X-axis represents the cumulative freedom from CLAD. The Y-axis represents the time in years after transplant.

