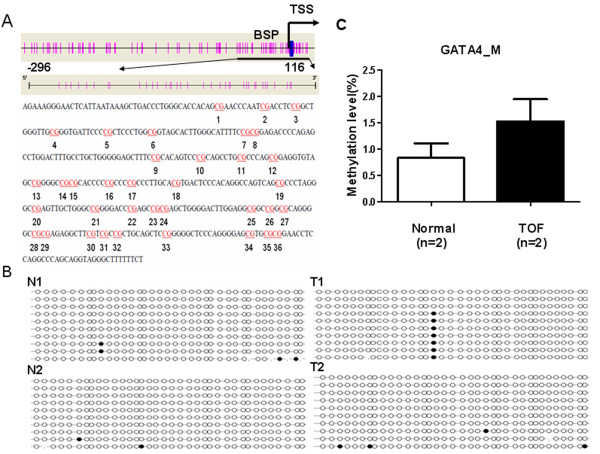
Figure 5.
Bisulfite sequencing PCR (BSP) results for GATA4. (A) A schematic represents the distribution of the CpG site in the GATA4 gene and the analyzed sequence represents a 413 base pair fragment (positions -296–116) in the promoter region of GATA4 gene; (B) BSP sequencing results, N1 and N2 represent the normal control, T1 and T2 represent the TOF subjects; (C) Methylation level for GATA4_M.

