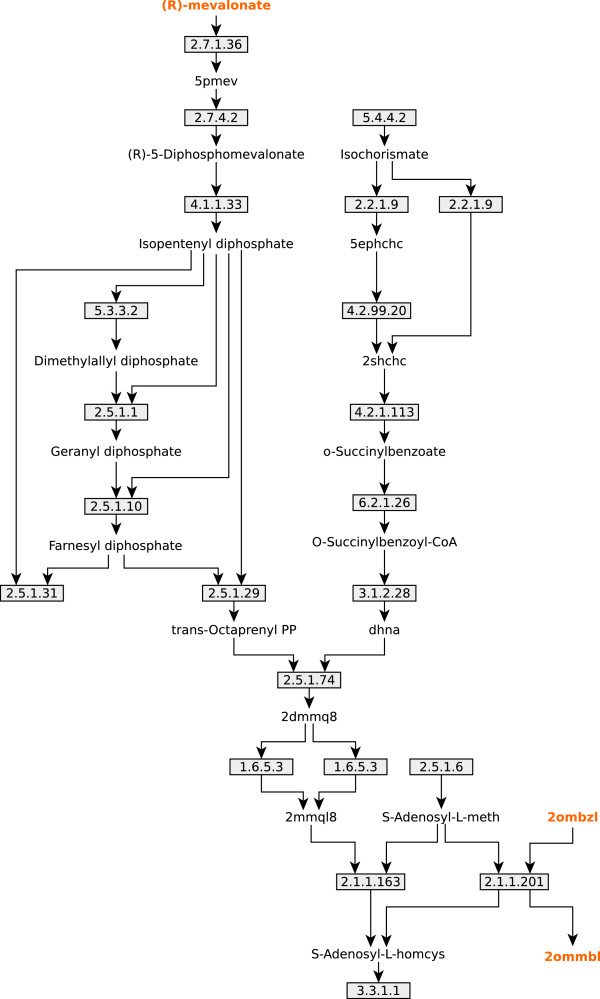
Figure 3.
UM1 scheme. Schematic representation of the biggest UM found in B. cuenoti iCG238 model, which includes all the reactions belonging to the Menaquinol Biosynthetic Pathway. Metabolites are represented by name labels and colored accordingly to its category (yellow for RNP and RNC; black for DNP and UNC); reactions are represented as squares with its associated EC number.

