
Figure 1.
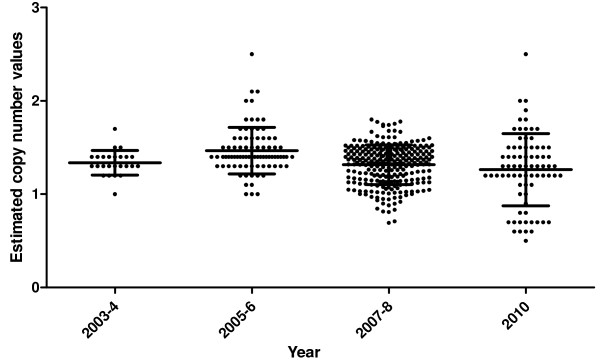
Estimated copy number values for parasite isolates from Ghana per time points. Each dot represents the estimated copy number value per parasite. Lines represent the mean and standard deviation of the estimated copy number value for the isolates.