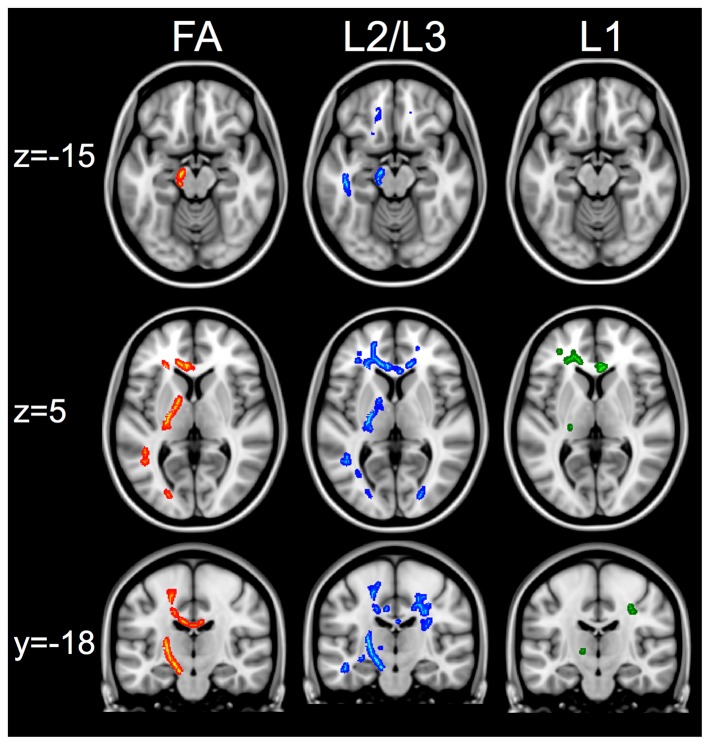
Figure 3.
White matter changes between healthy controls and patients. First column shows regions of interest in the corticospinal and transcallosal M1–M1 tracts that have greater FA in controls compared to patients. Second column shows the same regions of interest that show greater radial diffusivity (L2/L3) in patients compared to controls. The third column shows that in the same regions, there are no changes in axial diffusivity (L1) measures when comparing patients versus controls. The skeletonized results are thickened to aid visualization of results. All images show results that are significant at t > 3.1, p < 0.05 FWE using cluster thresholding.

