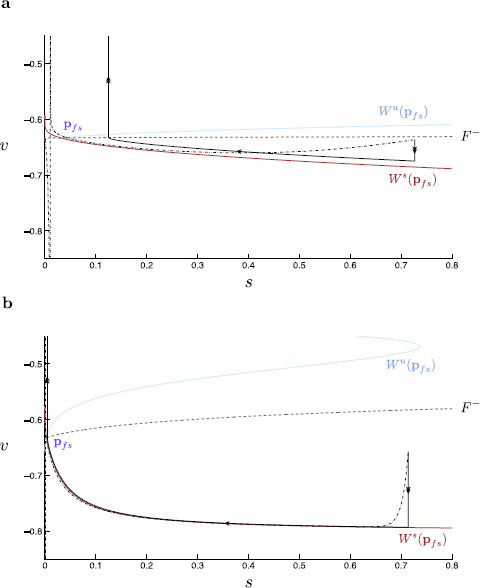
Fig. 14.
Singular and nonsingular trajectories of the original and modified propofol model. Singular global trajectories (black, solid) are here overlaid with their corresponding nonsingular propofol model trajectories (black, dashed). Here, we compare the original and modified propofol model solution trajectories and singular limit predictions for (spiking occurs in both models for this value). a Within the original propofol model, solution trajectories are kept in close proximity to the lower fold curve. Near the fold, normal hyperbolicity is lost and the time-scale separation between fast and slow variables breaks down. Hence, the singular trajectory does not accurately describe the fast approach onto the critical manifold. This results in a substantial deviation of solution trajectories from the singular limit prediction of subsequent slow dynamics; note, for example, the discrepancy between the s-values at which the non-singular and singular trajectories spike. b The modified propofol model solution trajectories are no longer constrained near the fold curve, and thus the time-scale separation is preserved. This results in a more accurate singular limit prediction of nonsingular trajectories

