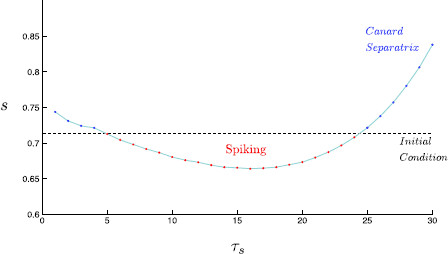
Fig. 9.

Singular limit prediction of spiking. Within the singular limit, the position of the base point determines whether a singular trajectory results in a rebound spike. We plot the s-value of the trajectory initial condition (black dashed), which coincides with the base point on the critical manifold. Note that the initial condition, and thus the base point is independent of . For integer values of , the s-value at which the corresponding canard separatrix crosses the v-value of the base point (red/blue points) is plotted. Thus, if an initial condition lies at a higher s-value than the corresponding canard separatrix (red), the trajectory falls onto the region of , for which a trajectory rebound spikes. Otherwise, if the initial condition lies at a lower s-value than the corresponding canard separatrix (blue), the trajectory does not go on to spike. A linear interpolation shows the roughly parabolic shape, which gives rise to two rebound spiking transitions, and thus a single range of for which there exists rebound spiking. An animation of this figure under variation of is given within Additional file 1
