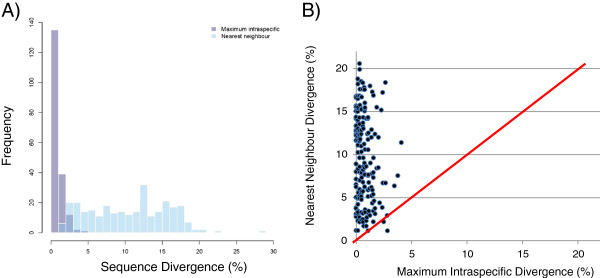
Figure 2.

Maximum intraspecific and nearest neighbour (interspecific) divergences for all species of Coleoptera in the Churchill barcode library, based upon barcode sequences of at least 500 bp. A histogram (A) indicates overlap in the ranges of these values, while a plot with each species represented as a point (B) shows that nearly all species fall above the red 1:1 line, reflecting genetic separation between conspecifics and neighbouring species.
