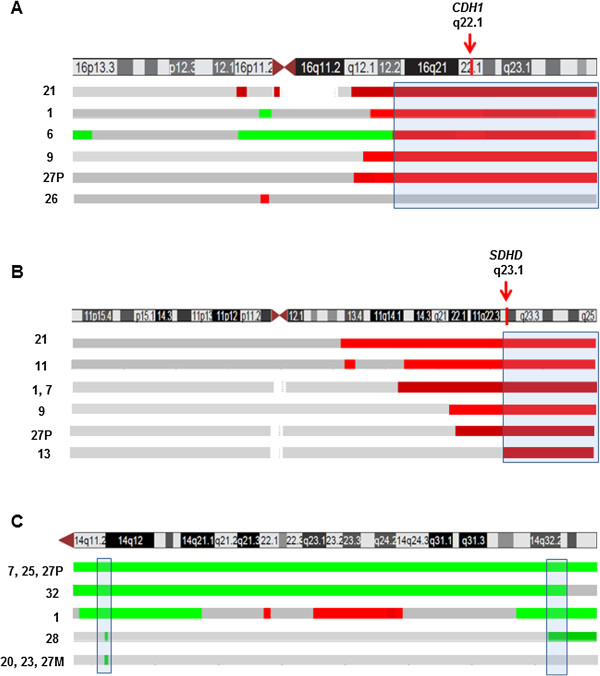
Figure 2.

Mapping of CN losses in (A) chromosomes 16 and (B) 11 (B) and (C) localization of CN gains in chromosome 14 by a-CGH. For each chromosome is shown an ideogram (UCSC Genome Browser) together with bars indicating losses in green and gains in green. The genomic location of the CDH1 and SDHD genes analyzed by qPCR are marked by arrows.
