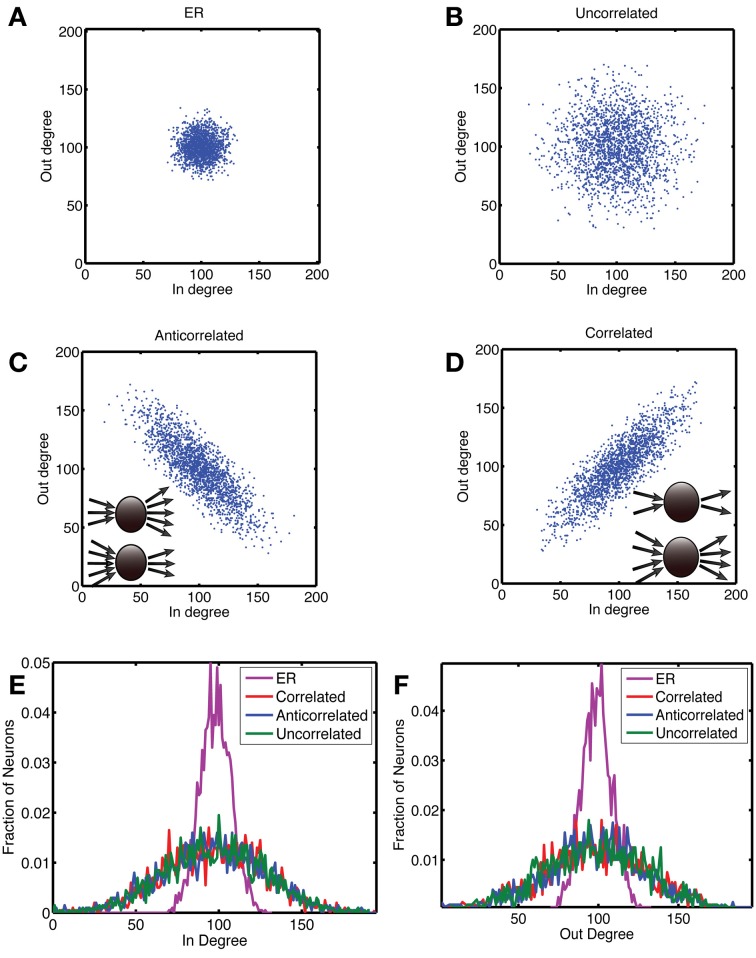
Figure 1.
Construction of networks with a correlation between out- and in-degree. In panels (A) to (D), we show scatterplots of the out-degree vs. in-degree, whereas the corresponding marginal distributions are shown for (E) the in-degree and (F) the out-degree. We considered four types of networks, each with N = 2000 neurons and a connection probability of pc = 0.05. (A) The Erdos-Renyi (ER) network in which each connection is chosen at random with a probability pc = 0.05, for which there is no correlation [ρ = 0.0034 (standard deviation: 0.018)] and the relative variance of in- and out-degree across neurons is small for large networks. In order to examine networks with a higher variance of degree values, we first generated a degree distribution in the form of a truncated, bivariate Gaussian. In (B) the covariance matrix was diagonal, with equal variance for the out- and in-degrees, which yielded uncorrelated in- and out-degrees [ρ = 0.0010 (0.019)]. To generate correlations we started from a covariance matrix with unequal variances and rotated it by 45 degrees anticlockwise to obtain (C) anti-correlated [ρ = 0.821 (0.0085)] and by 45 degrees clockwise to obtain (D) correlated degree distributions [ρ = 0.821 (0.0085)]. In the anti-correlated case, nodes with a high out-degree had a low in-degree and vice versa, whereas in the correlated case, nodes with a high out-degree also had a high in-degree, as illustrated by the insets in (C) and (D), respectively. (E,F) The networks were constructed so that the marginal distributions for the correlated (red), anti-correlated (blue) and uncorrelated (green) case were the same. The ER network (purple) had much tighter marginal distributions.

