Figure 3.
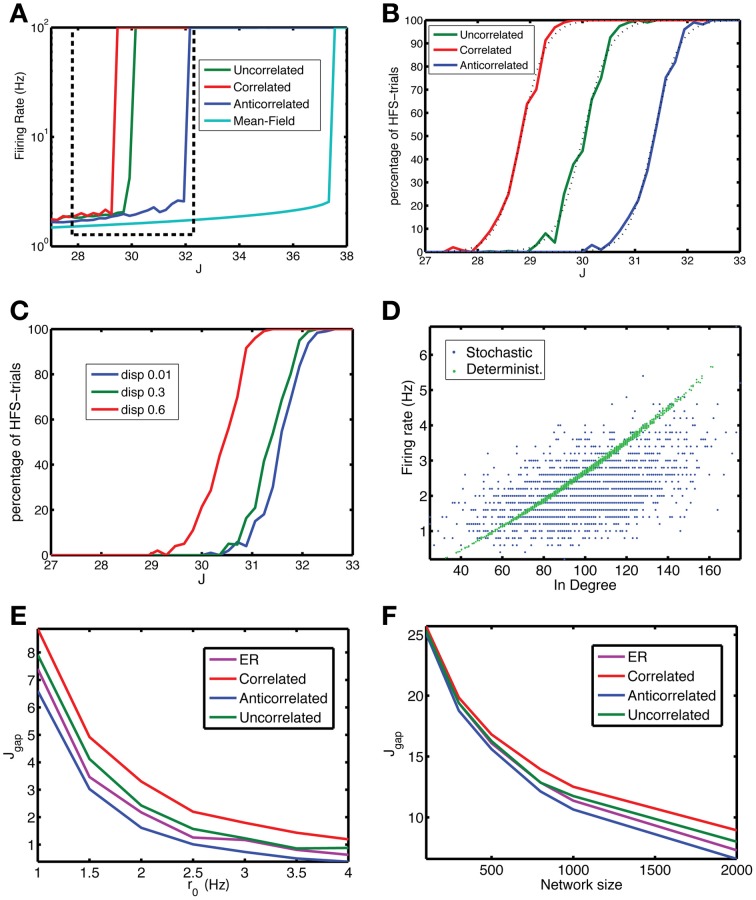
The anti-correlated network is more stable against fluctuations. (A) The firing rate vs. coupling strength for the mean-field solution (cyan) and networks with uncorrelated (green), correlated (red) or anti-correlated (blue) degree distributions (r0 = 1 Hz, N = 2000). The anti-correlated degree distribution leads to the most stable network. The dashed box approximately indicates the interval of coupling strengths highlighted in panels (B) and (C). (B) Despite the existence of a stable LFS for a particular coupling strength, fluctuations in network activity may perturb the network away from it and the network ends up in the co-existing stable HFS state. The fraction of states that end up in the HFS state is close to zero far below Jc and increases to unity above Jc. The LFS state is more stable for the anti-correlated (blue) network than for the uncorrelated network (green), which in turn is more stable than the correlated network (red). The dashed lines are fits to the sigmoidal function in Equation 10. (C) The stability depends on the strength of the correlation. When the width (dispersion) corresponding to the small axis in the bivariate Gaussian degree distribution is increased, which means lower correlation, the stability is reduced. Data are for an anti-correlated network. (D) A neuron's firing rate is correlated with its in-degree, but the degree of correlation is reduced to 0.519 (0.014) due to jitter in this relation for Equation 1 (blue dots) from 0.997 (0.002) for Equation 9 (green dots). Data for anti-correlated network, J = 30.96. (E,F) The degree of stability can be qualified by Jgap, the distance of the Jc for the finite-size network from that for the mean-field network, shorter distances meaning more stable networks. Jgap decreases with the (E) baseline firing rate r0 and with (F) network size. In both panels the anti-correlated network (blue line) corresponds to the lowest curve indicating higher stability compared to ER (purple), uncorrelated (green) and correlated (red), an advantage that increases with network size. The network had N = 2000 neurons, for each coupling strength Nt = 100 simulations were performed, with a length of 500 time steps, of which the first 100 were discarded as a transient.

