Figure 5.
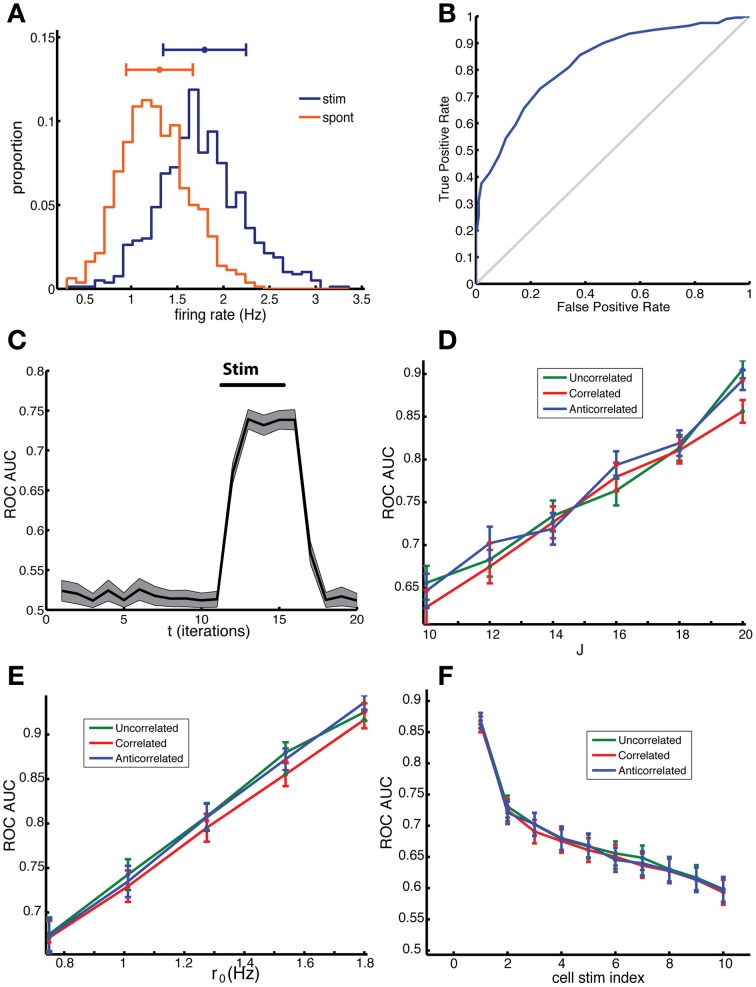
Network sensitivity, when evaluated using an ROC analysis, depends only on the mean out-degree of the stimulated neurons and not on the degree correlations. (A) Distribution of firing rate across cells in a 10 ms time bin for spontaneous activity (red) and for the stimulated network (blue), in which 8 random cells were stimulated. Note that the stimulated cells were not included in this ROC analysis and we used the binary responses xi(t) to determine the firing rate. (B) The corresponding ROC curve (blue) quantifies the difference between the distributions, relative to the diagonal (gray), which represents distributions that cannot be distinguished. (C) The area under the curve (AUC) for the ROC curves calculated for different time bins. The AUC before stimulation was close to 0.5 because the distributions were the same apart from fluctuations due to sampling. After the stimulation, which started at t = 10 and ended at t = 15, the AUC rose to around 0.75. (D) The AUC increases with increasing coupling constant and (E) with increasing baseline firing rate. (F) The AUC depended on the mean out-degree of the stimulated neurons. Neurons were divided into ten groups according to their out-degree, with the first group having the highest out-degree. The group index is indicated on the x-axis. The results in (D–F) were not significantly different for correlated (red), anti-correlated (blue) or uncorrelated (green) networks, t-test, p = 0.4479, 0.6279, 0.7421, respectively. The network was comprised of N = 2000 neurons, of which np = 8 neurons were stimulated for the duration of Tstim = 6 time units starting on the 10th bin. In panel (A–C) results for an uncorrelated network are shown. Parameters: (A–C,F) J = 18, r0 = 1; for (D) r0 = 1 and (E) J = 20.

