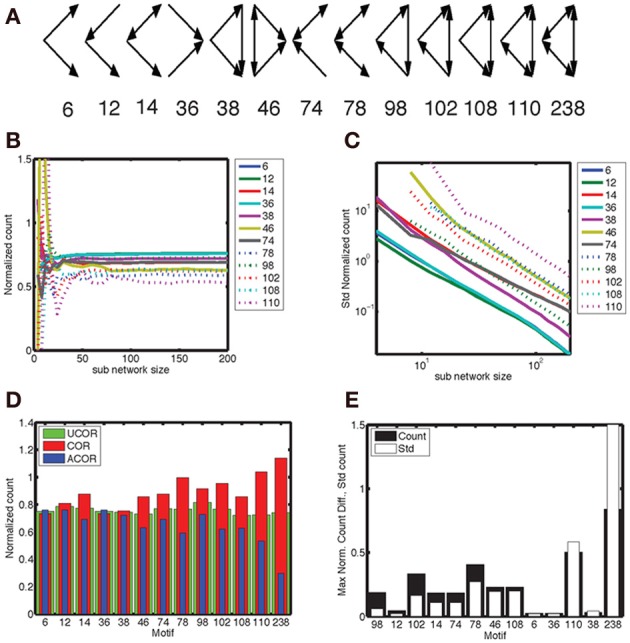
Figure 7.

Motif 98 is the most sensitive to degree correlations. (A) There are 13 motifs that involve 3 connected nodes. Below the graphical representation we plot the numbering used here, which follows Itzkovitz et al. (2003). The expected number of motifs depends on network size, hence we normalize the count by N3(k/N)e, with N the number of nodes, k the expected number of edges per node and e the number of edges in the motif. In addition, we include a numerical factor representing the equivalent permutations [listed in Table 3 in Itzkovitz et al. (2003)]. (B) The normalized counts, averaged across a thousand realizations, converge to constant values for sub-networks larger than 50–100 nodes, with the precise value depending on the complexity of the motif involved. (C) The standard deviation of the normalized counts fall off as N−3/2. We illustrate the results for the anti-correlated network, which are typical for the correlated and uncorrelated network also. In addition, we omitted motif 238 because it occurs at such a low probability that it makes the statistics noisy. (D) The normalized counts for each motif for the (red) correlated, (blue) anti-correlated and (green) uncorrelated networks. We used the counts for the full network, rather than sub-networks. Network size in panel (D) and (E) was N = 200. We used a bivariate Gaussian degree distribution with a mean number of nodes equal to 10, a standard deviation along the long axis of σy = 3.33 and along the short axis of σx = 1.0. (E) The maximum difference in mean count between all three possible comparisons (black bars), relative to the mean standard deviation of these counts across the three network types. The motifs are ordered on the count over standard deviation ratio, starting with the largest. According to this analysis motif 98 should be used to best distinguish between different network correlation structures.
