
Figure 8.
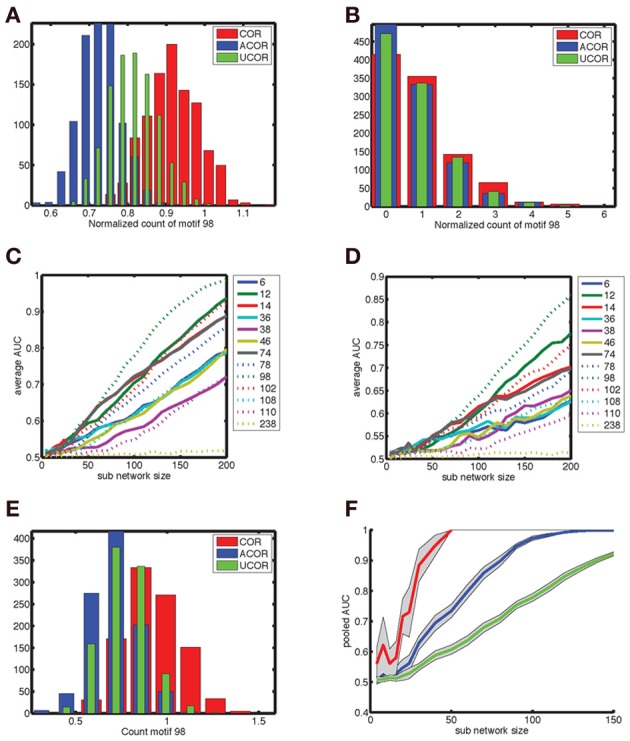
Degree correlations can be distinguished by pooling fifty measurements of networks at least thirty neurons in size. (A) Motif count varies across network realizations, but degree correlations can be distinguished when the corresponding distribution show little overlap. We show the distribution of the normalized counts of motif 98 for (red) correlated, (blue) anti-correlated, and (green) uncorrelated networks with 200 neurons. (B) For smaller sub-networks (Nsub = 30), the distributions overlap. Furthermore, these distributions are not Gaussian as they are skewed because counts are always positive. Hence, a more general procedure, such as the ROC analysis needs to be used instead of looking at the differences in mean count relative to the standard deviation. (C,D) The area under the ROC curve (AUC) as a function of sub-network size Nsub for the comparison (C) between correlated and anti-correlated networks and (D) between anti-correlated and uncorrelated networks. Each motif is labeled with a line style and color as indicated in the legend. Motif 98 is most sensitive in both cases (as well as for the correlated vs. uncorrelated comparison that is not shown). It is more difficult to distinguish an anti-correlated network from an uncorrelated one than to distinguish it from a correlated network. The average AUC values were determined based on the AUC value for each of twenty different motif distributions of 500 network realizations, which were sampled randomly with replacement out of 1000 realizations. (E) The motif distribution for Nsub = 30 can be pooled across Nav = 50 network realizations in order to shrink the width of the distribution, so that the differences in mean counts become clearer [(compare to panel (B)]. (F) The AUC for larger Nav values reaches unity (distributions are perfectly distinguishable) for smaller sub-network sizes. We show (green) no pooling, (blue) pooling across Nav = 5 realizations and (red) pooling across Nav = 50 realizations. The AUC goes from 0.7 to 1.0 between Nsub = 30 and 50 when pooled across Nav = 50 realizations, indicating that networks of size 30 can be used to determine degree correlation structure.